Last Updated on October 30, 2026 by Webmaster
I decided to layout the methods used in a separate document so as not to clutter the main report.
The overall format of the report is a decade comparison, the current year to the decade preceding, for example if the report is for 2023 then the data for 2023 is compared to 2013 to 2022 inclusive.
All data is taken from the ANSS catalog search. The data is gathered in CSV format and is then placed as is into an SQL Server database. From there it is converted into the QVS data table format, the only difference being the format of the date and time and the addition of a calculation for energy. The formula used for this is as follows:
Es = (10^(4.8+(G2*1.5)))/(10^3)
This gives the energy in kilojoules which is the standard storage value for my database. During subseqent calculations the energy value is uplifted to Terajoules:
Es = (10^(4.8+(G2*1.5)))/(10^12)
A magnitude 5 earthquake is 2 TJ of energy this scale has been used throughout. See Wikipedia for information on Joules
The data values are last refreshed just before the date of the report thus most of the changes that would be in the pipeline should have been implemented by now, but you should be aware that data can changes up to as much as 2 years later although that is perhaps unusual.
The radiated energy can be obtained in various ways. Historically, the radiated energy was estimated empirically (from observations) from magnitude Ms through the Richter formula, log Es = 4.8 + 1.5Ms, where Es is seismic energy in Joules. In this formula, magnitude is measured first, after which the formula is used to obtain Es.
The data used in the analysis is normally available for download on request in either MS Excel XLSX format (.xlsx), Open Document Spreadsheet format (.ods) or Comma Separated VAriable (.csv). If you are unable to use this format please leave a message (do NOT put your email address in the message body) and I will email you a CSV file.
[Download not found]
The global figures are broken down into the 50 seismic regions called the Flinn-Engdahl regions, as shown on the map below.
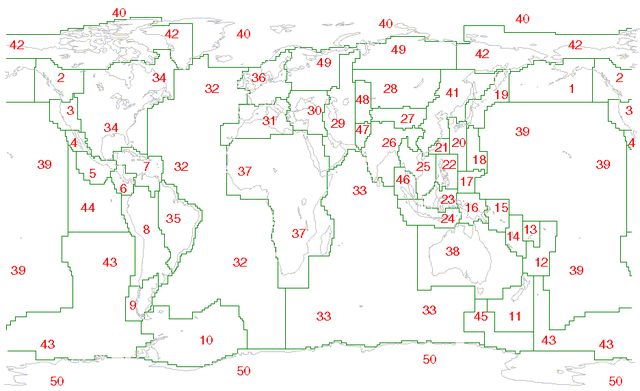
Further detail can be obtained here
Please note that the seismic regions are the 50 regions which is not made clear by Wikipedia. These regions are further sub-divided into smaller regions that may or may not be seismic entities and which are designated as geographic regions.
For each of the seismic regions, and of course for the world as a whole, I have added together the energy value of the earthquakes in each year, in each magnitude band, and also calculated the count of earthquakes in each band.
These reports only considers earthquakes of magnitude 5.0 or greater.