Last Updated on June 9, 2026 by Webmaster
Global Values
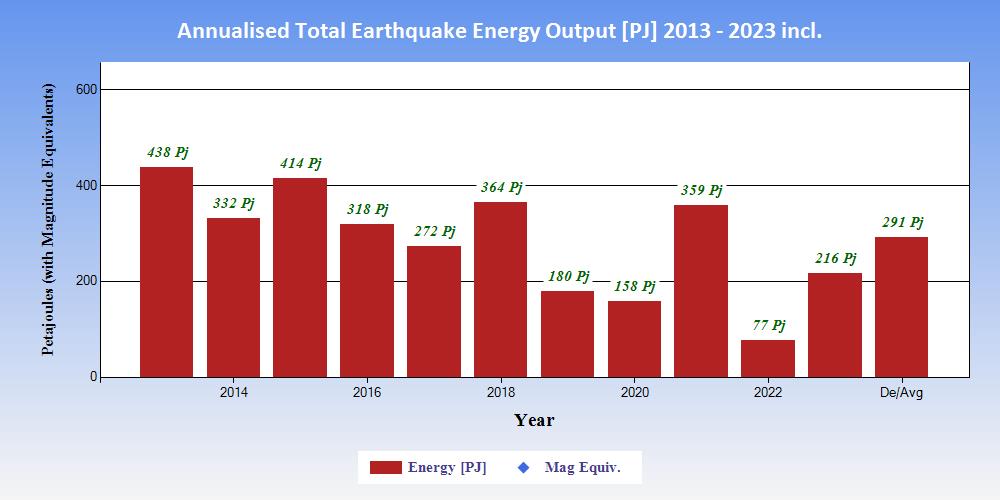
| Table showing the ranking of 2023 within the 11 years 2013 to 2023 inclusive in terms of energy output in Petajoules. |
|
The biggest earthquakes, i.e. those of Magnitude 8 and over were as follows:-
| DateTime | Latitude | Longitude | Magnitude Mw | Depth | Location |
| 2013-02-06T01:12:25Z | -10.799 | 165.114 | 8.0 | 24.0 | Santa Cruz Islands (14) |
| 2013-05-24T06:44:48Z | 54.892 | 153.221 | 8.3 | 598.1 | Sea Of Okhotsk (41) |
| 2014-04-02T00:46:47Z | -19.610 | -70.769 | 8.2 | 25.0 | Near Coast Of Northern Chile (8) |
| 2015-09-16T23:54:32Z | -31.573 | -71.674 | 8.3 | 22.4 | Near Coast Of Central Chile (8) |
| 2017-09-08T05:49:19Z | 15.022 | -93.899 | 8.2 | 47.4 | Near Coast Of Chiapas. Mexico (5) |
| 2018-08-19T01:19:40Z | -18.113 | -178.153 | 8.2 | 600.0 | Fiji Islands Region (13) |
| 2019-05-26T08:41:15Z | -5.812 | -75.270 | 8.0 | 122.6 | Northern Peru (8) |
| 2021-03-04T19:28:33Z | -29.723 | -177.279 | 8.1 | 28.9 | Kermadec Islands. New Zealand (12) |
| 2021-07-29T07:15:49Z | 55.364 | -157.888 | 8.2 | 35.0 | Alaska Peninsula (1) |
| 2021-08-12T19:35:17Z | -58.375 | -25.264 | 8.1 | 22.8 | South Sandwich Islands Region (10) |
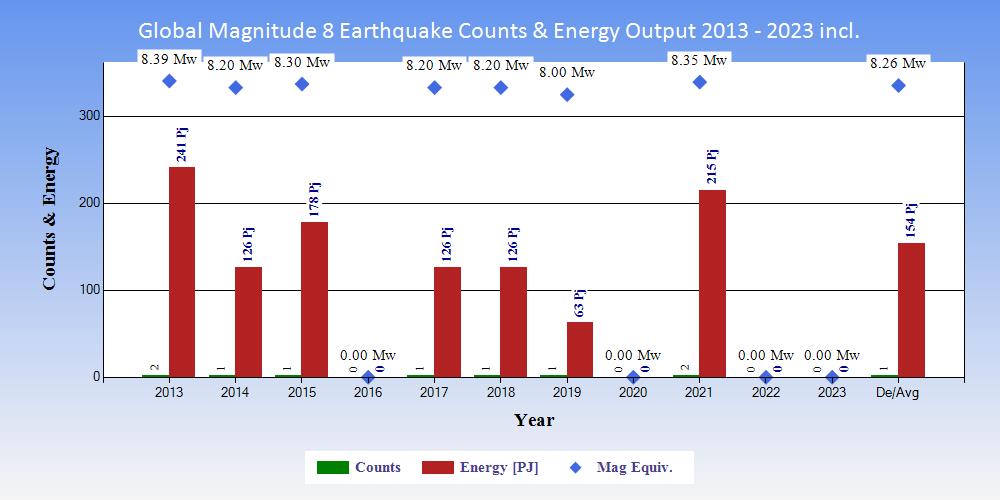
| Tables showing the ranking of 2023 within the 11 years 2013 to 2023 inclusive in terms of counts of earthquakes and energy output. |
|
|
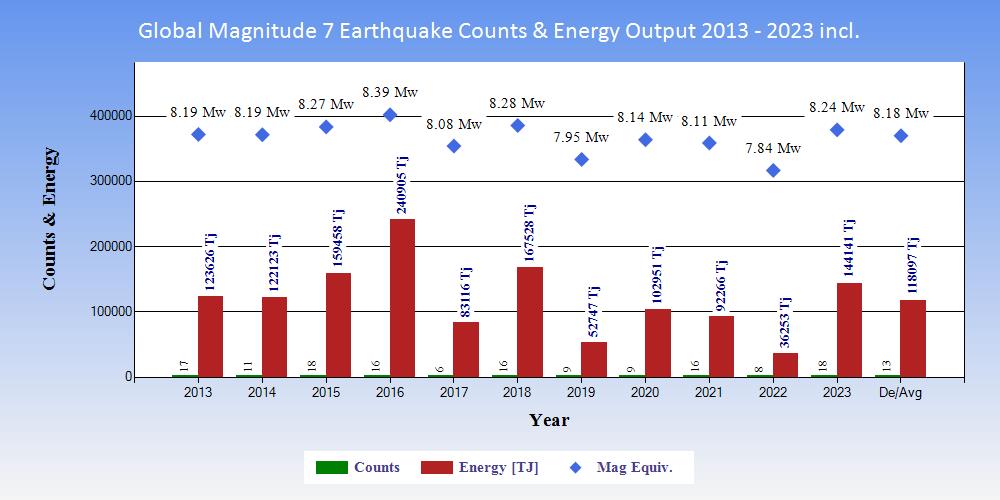
| Tables showing the ranking of 2023 within the 11 years 2013 to 2023 inclusive in terms of counts of earthquakes and energy output. |
|
|
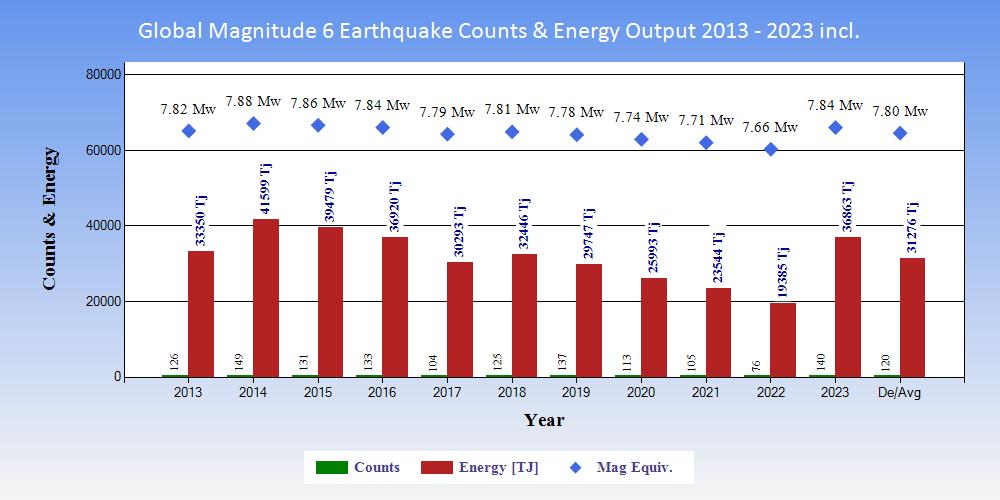
| Tables showing the ranking of 2023 within the 11 years 2013 to 2023 inclusive in terms of counts of earthquakes and energy output. |
|
|
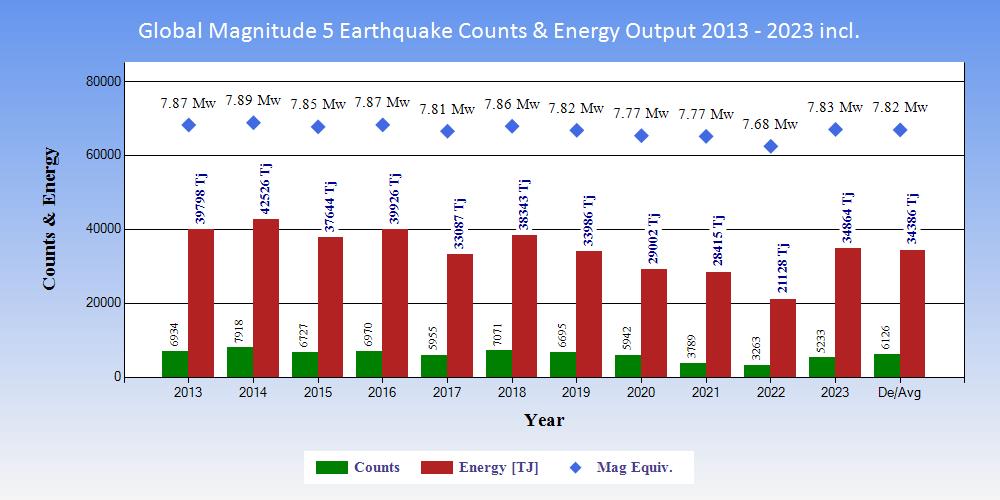
| Tables showing the ranking of 2023 within the 11 years 2013 to 2023 inclusive in terms of counts of earthquakes and energy output. |
|
|
Regional Values
Seismic Region 1 - Alaska - Aleutan arc
Seismic Region 2 - Southeastern Alaska to Washington
Seismic Region 3 - Oregon - California and Nevada
Seismic Region 4 - Baja California and Gulf of California
Seismic Region 5 - Mexico - Guatemala Area
Seismic Region 6 - Central America
Seismic Region 7 - Caribbean loop
Seismic Region 8 - Andean South America
Seismic Region 9 - Extreme South America
Seismic Region 10 - Southern Antilles
Seismic Region 11 - New Zealand region
Seismic Region 12 - Tonga - Samoa Basin area
Seismic Region 13 - Fiji Islands area
Seismic Region 14 - Vanuatu Islands
Seismic Region 15 - Bismarck and Solomon Islands
Seismic Region 16 - New Guinea
Seismic Region 17 - Caroline Islands area
Seismic Region 18 - Guam to Japan
Seismic Region 19 - Japan - Kuril Islands - Kamchatka Peninsula
Seismic Region 20 - Southwestern Japan and Ryukyu Islands
Seismic Region 21 - Taiwan area
Seismic Region 22 - Philippine Islands
Seismic Region 23 - Borneo - Sulawesi
Seismic Region 24 - Sunda arc
Seismic Region 25 - Myanmar and Southeast Asia
Seismic Region 26 - India - Xizang - Sichuan - Yunnan
Seismic Region 27 - Southern Xinjiang to Gansu
Seismic Region 28 - Lake Issyk-Kul to Lake Baykal
Seismic Region 29 - Western Asia
Seismic Region 30 - Middle East - Crimea - Eastern Balkans
Seismic Region 31 - Western Mediterranean area
Seismic Region 32 - Atlantic Ocean
Seismic Region 33 - Indian Ocean
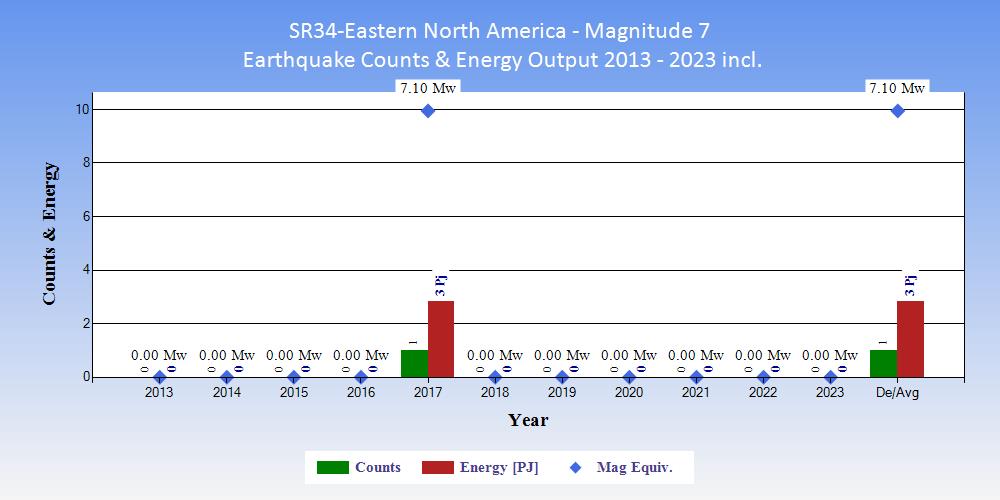
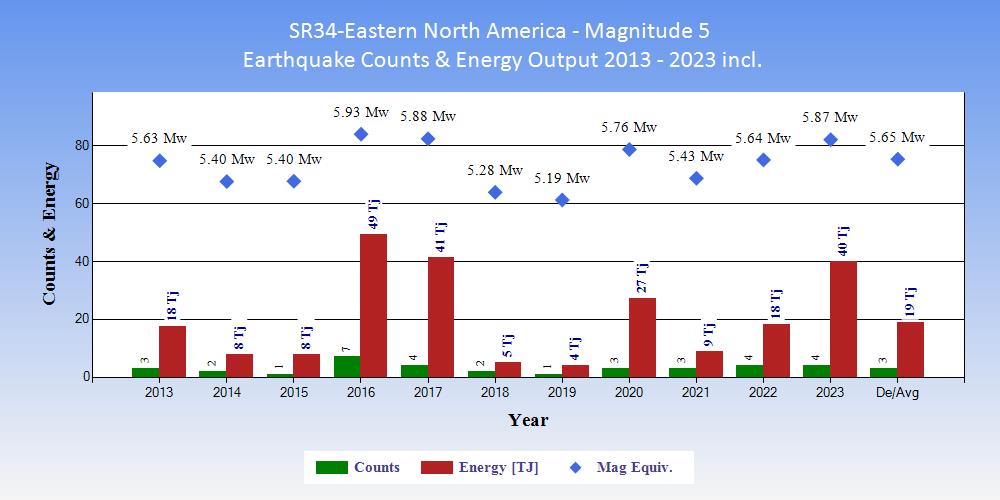
Seismic Region 34 - Eastern North America
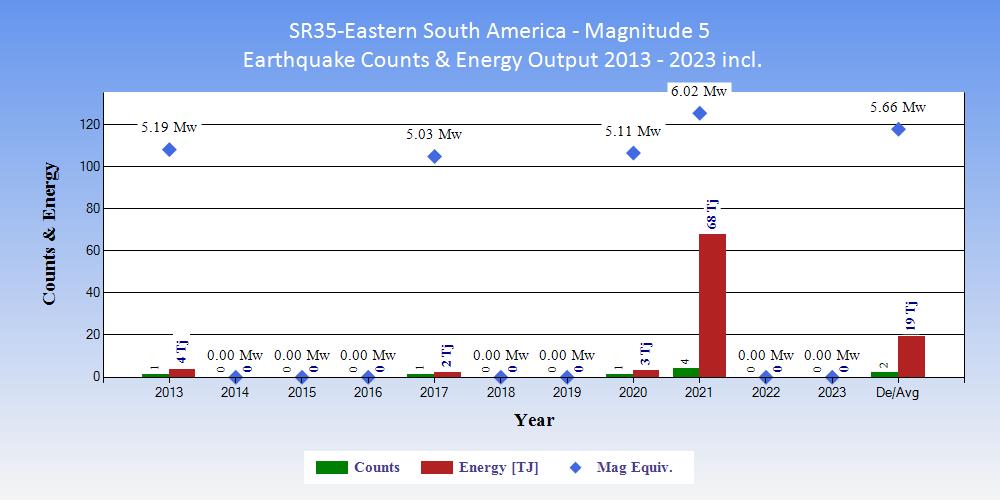
Seismic Region 35 - Eastern South America
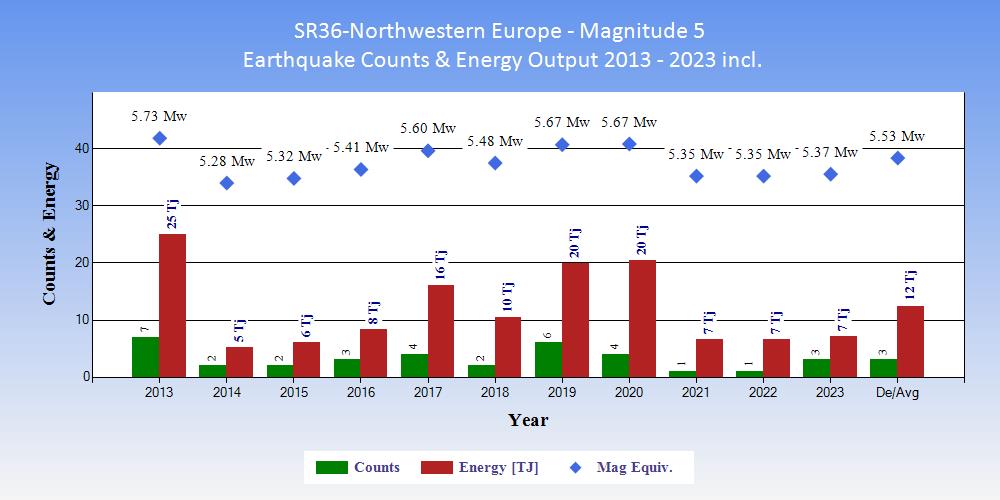
Seismic Region 36 - Northwestern Europe
Seismic Region 37 - Africa
Seismic Region 38 - Australia
Seismic Region 39 - Pacific Basin
Seismic Region 40 - Arctic zone
Seismic Region 41 - Eastern Asia
Seismic Region 42 - Northeastern Asia, Northern Alaska to Greenland
Seismic Region 43 - Southeastern and Antarctic Pacific Ocean
Seismic Region 44 - Galápagos Islands area
Seismic Region 45 - Macquarie loop
Seismic Region 46 - Andaman Islands to Sumatra
Seismic Region 47 - Baluchistan
Seismic Region 48 - Hindu Kush and Pamir area
Seismic Region 49 - Northern Eurasia
Seismic Region 50 - Antarctica
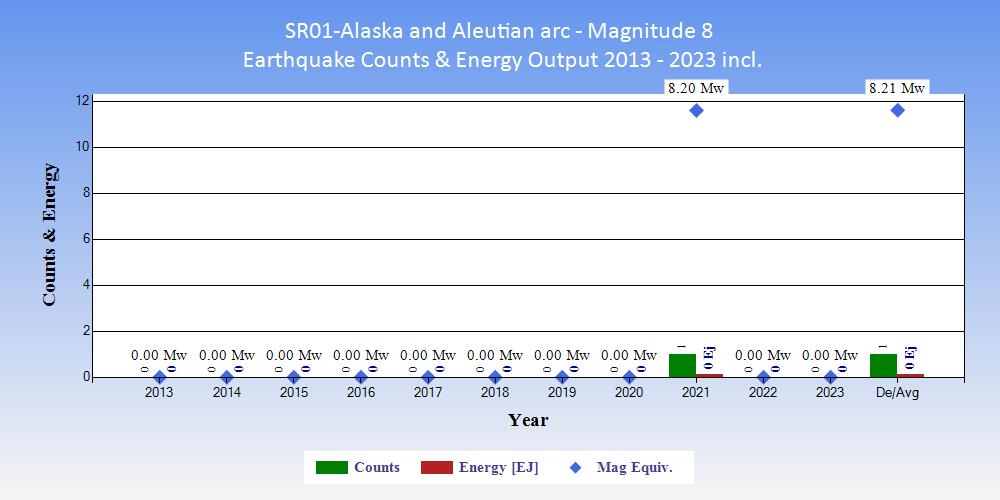
| Tables showing the ranking of 2023 within the 11 years 2013 to 2023 inclusive in terms of counts of earthquakes and energy output. |
|
|
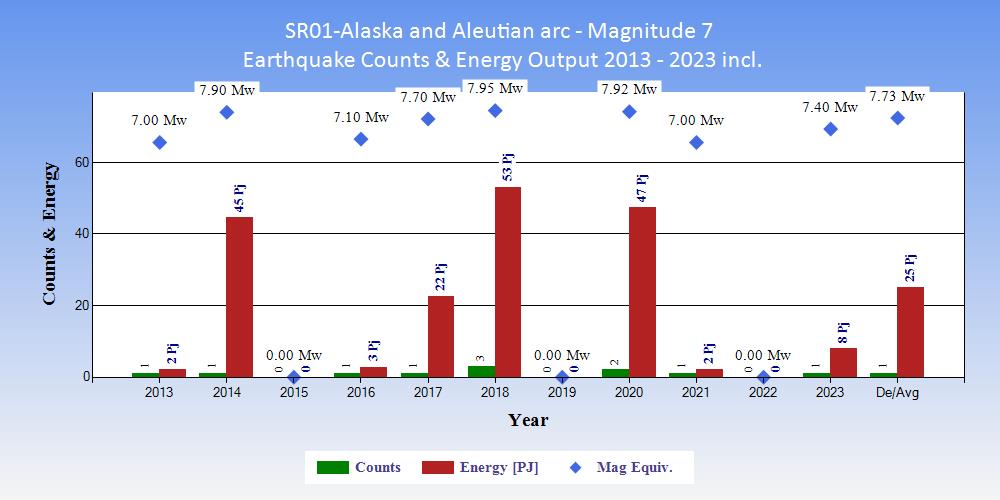
| Tables showing the ranking of 2023 within the 11 years 2013 to 2023 inclusive in terms of counts of earthquakes and energy output. |
|
|
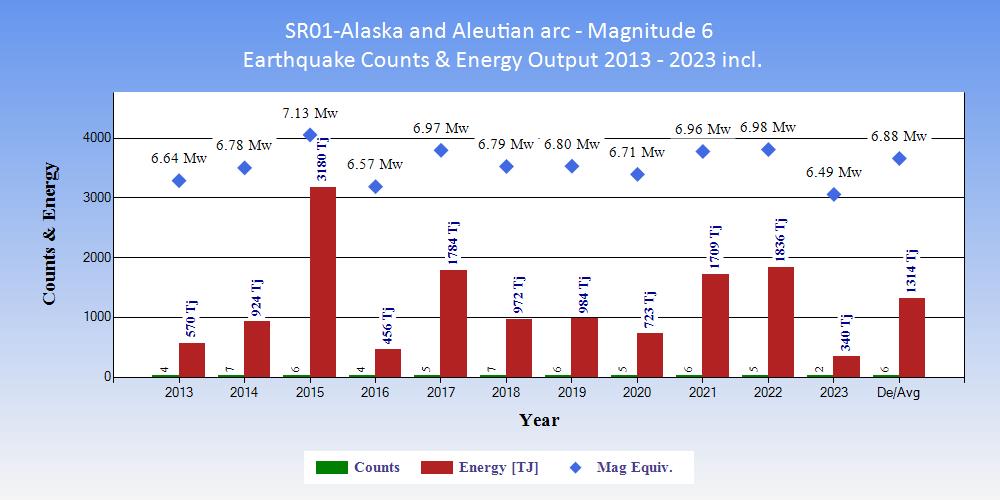
| Tables showing the ranking of 2023 within the 11 years 2013 to 2023 inclusive in terms of counts of earthquakes and energy output. |
|
|
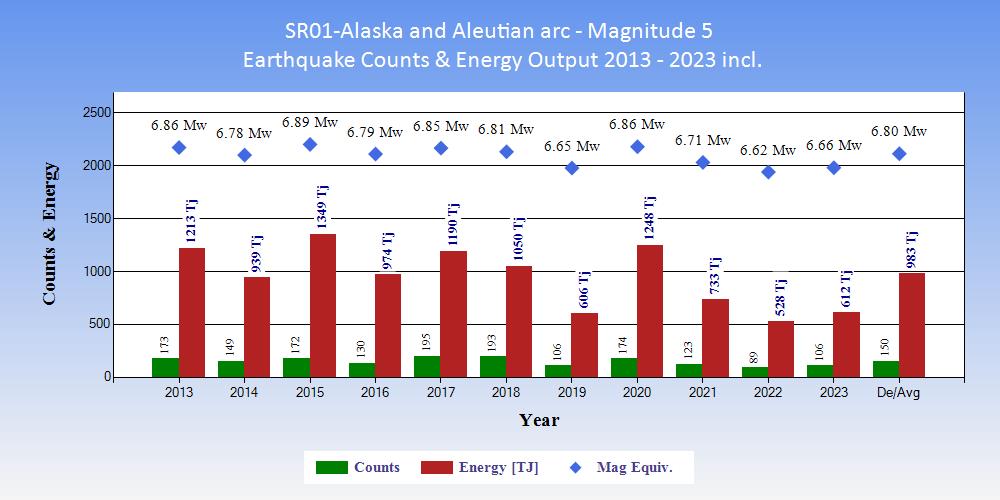
| Tables showing the ranking of 2023 within the 11 years 2013 to 2023 inclusive in terms of counts of earthquakes and energy output. |
|
|
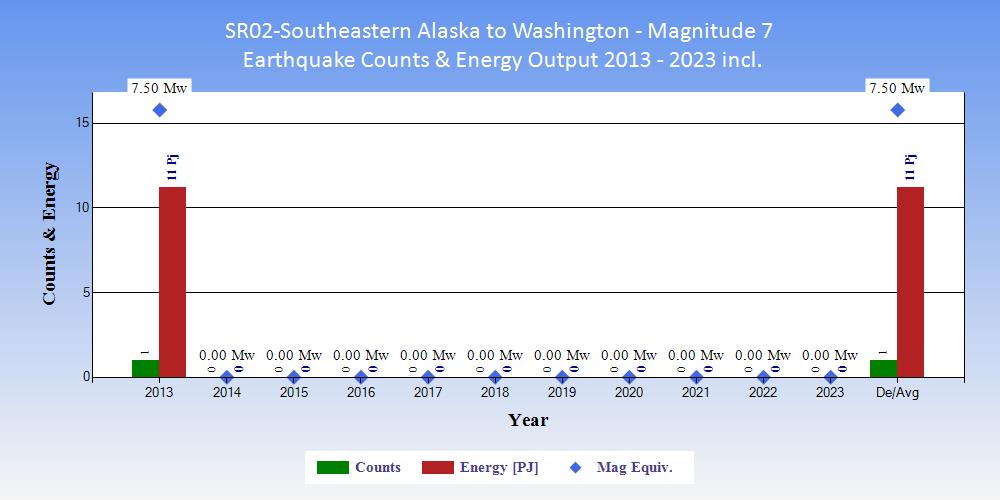
| Tables showing the ranking of 2023 within the 11 years 2013 to 2023 inclusive in terms of counts of earthquakes and energy output. |
|
|
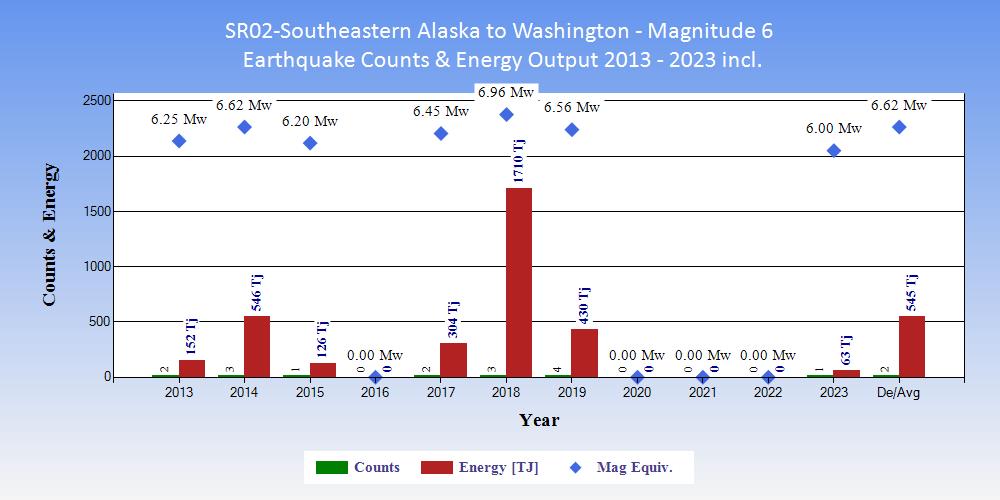
| Tables showing the ranking of 2023 within the 11 years 2013 to 2023 inclusive in terms of counts of earthquakes and energy output. |
|
|
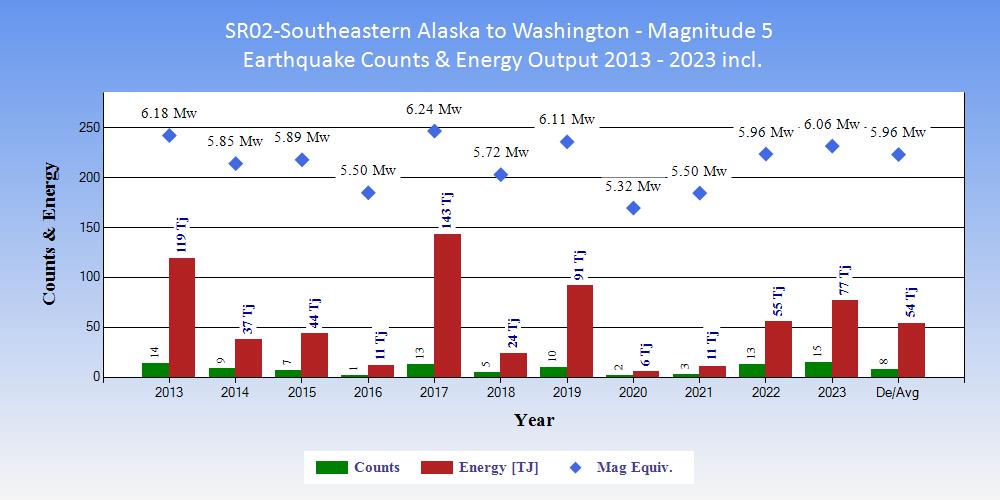
| Tables showing the ranking of 2023 within the 11 years 2013 to 2023 inclusive in terms of counts of earthquakes and energy output. |
|
|
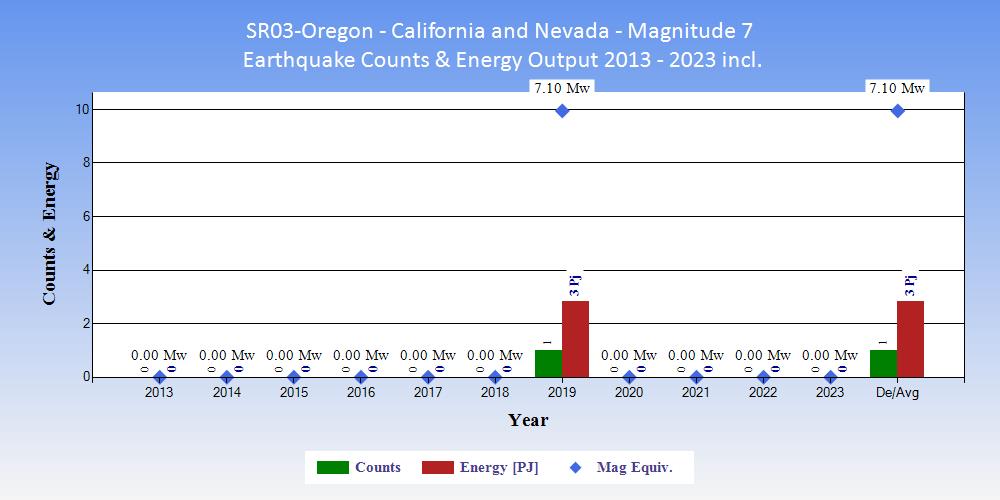
| Tables showing the ranking of 2023 within the 11 years 2013 to 2023 inclusive in terms of counts of earthquakes and energy output. |
|
|
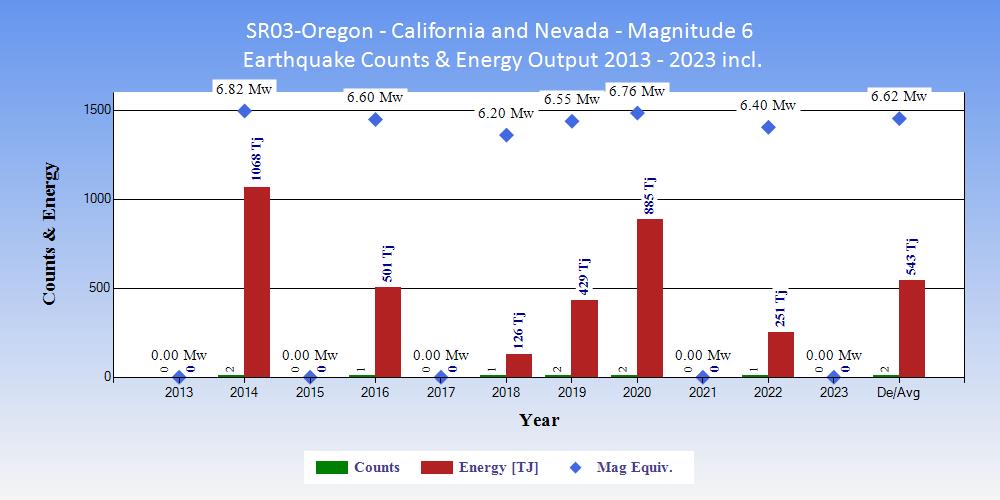
| Tables showing the ranking of 2023 within the 11 years 2013 to 2023 inclusive in terms of counts of earthquakes and energy output. |
|
|
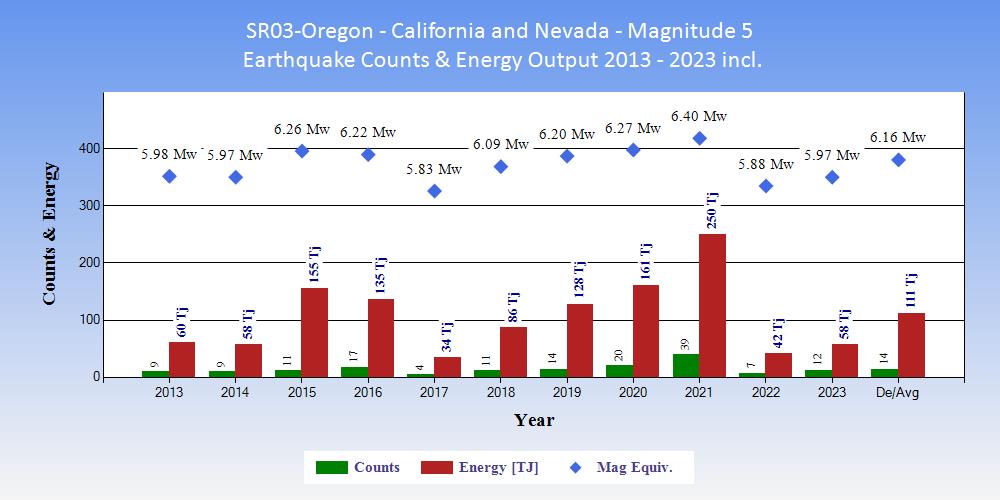
| Tables showing the ranking of 2023 within the 11 years 2013 to 2023 inclusive in terms of counts of earthquakes and energy output. |
|
|
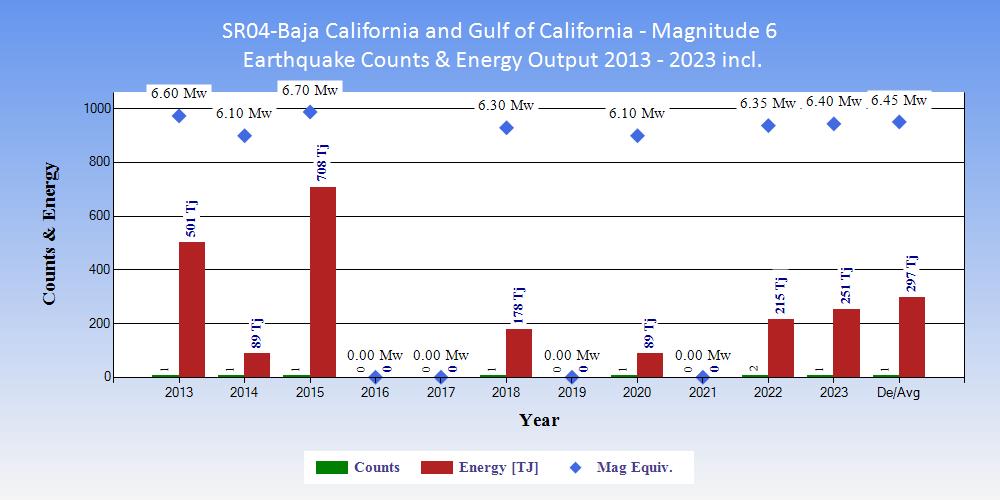
| Tables showing the ranking of 2023 within the 11 years 2013 to 2023 inclusive in terms of counts of earthquakes and energy output. |
|
|
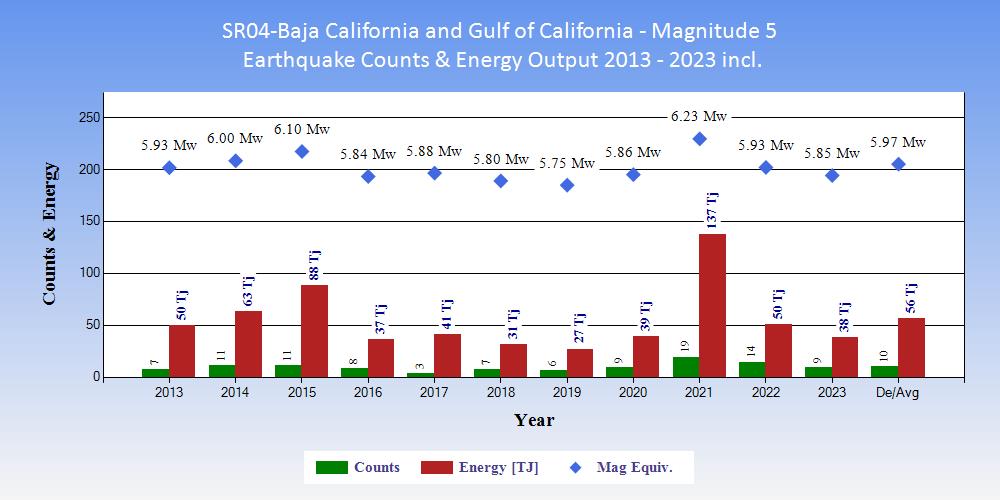
| Tables showing the ranking of 2023 within the 11 years 2013 to 2023 inclusive in terms of counts of earthquakes and energy output. |
|
|
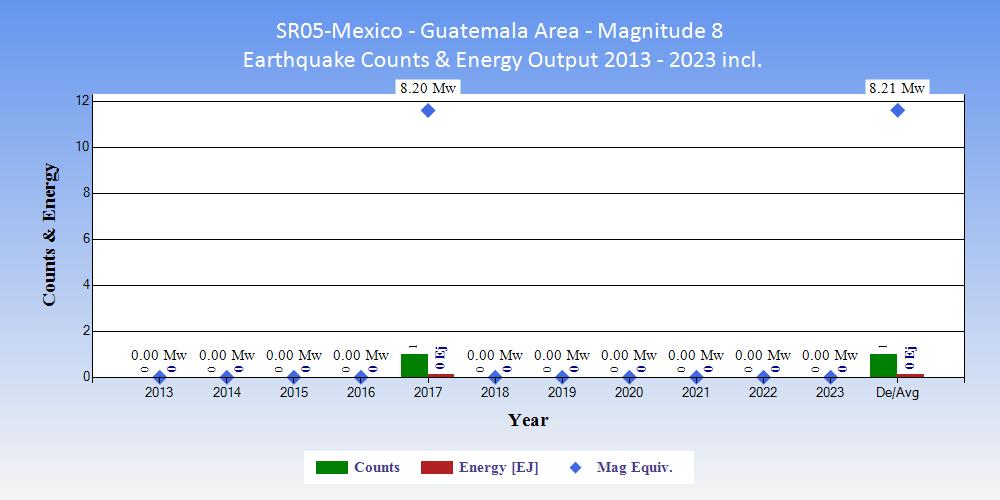
| Tables showing the ranking of 2023 within the 11 years 2013 to 2023 inclusive in terms of counts of earthquakes and energy output. |
|
|
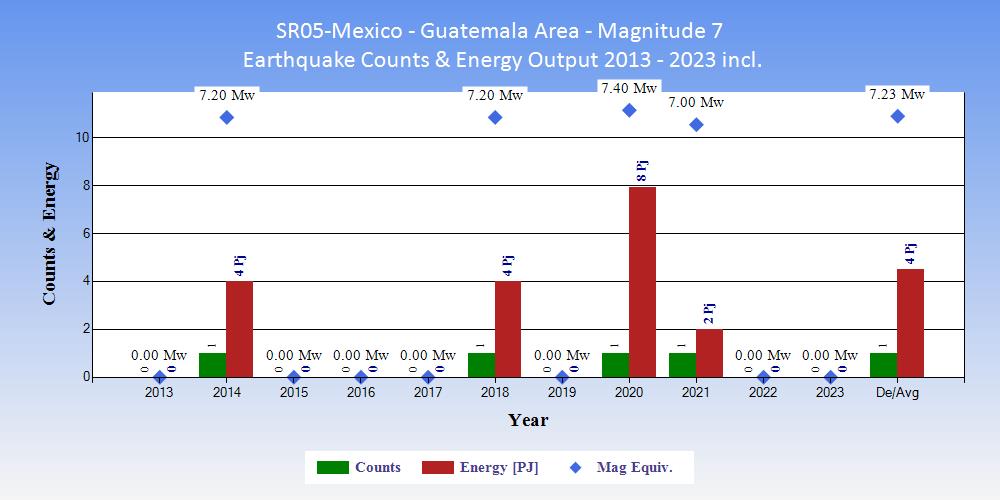
| Tables showing the ranking of 2023 within the 11 years 2013 to 2023 inclusive in terms of counts of earthquakes and energy output. |
|
|
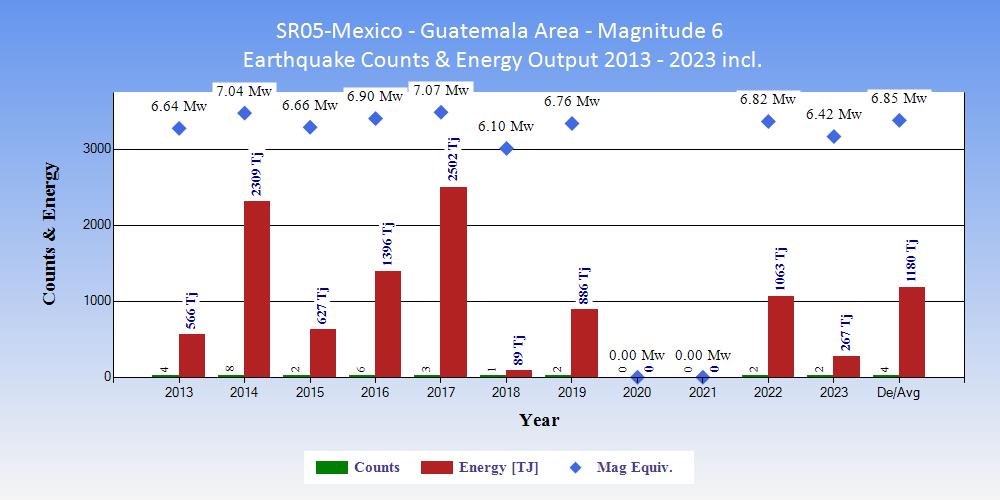
| Tables showing the ranking of 2023 within the 11 years 2013 to 2023 inclusive in terms of counts of earthquakes and energy output. |
|
|
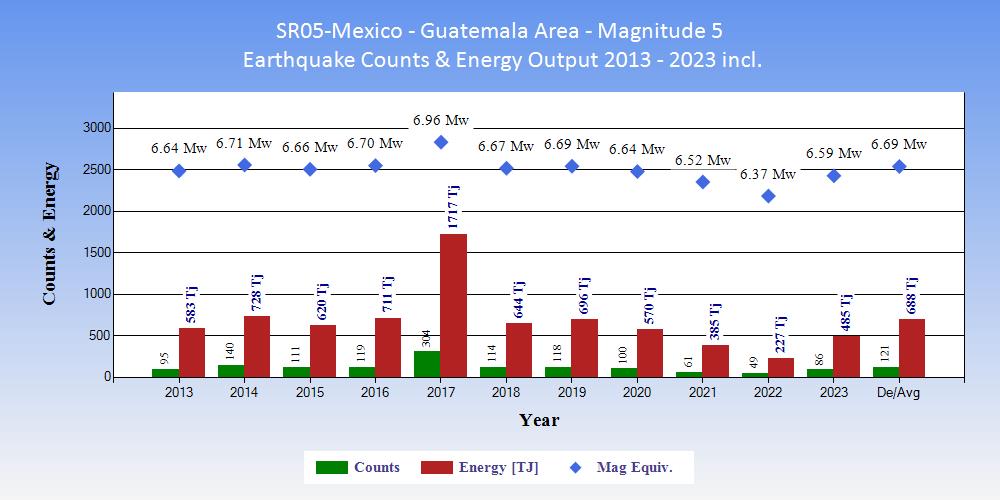
| Tables showing the ranking of 2023 within the 11 years 2013 to 2023 inclusive in terms of counts of earthquakes and energy output. |
|
|
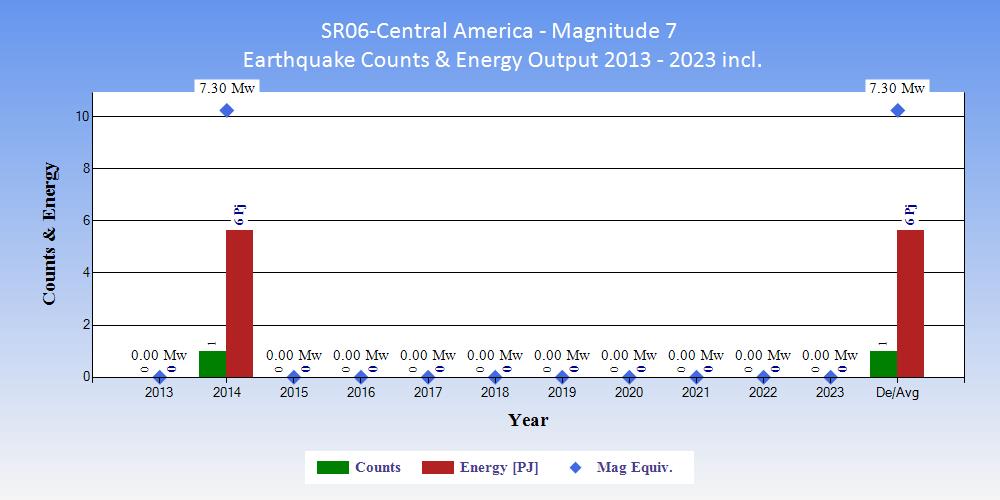
| Tables showing the ranking of 2023 within the 11 years 2013 to 2023 inclusive in terms of counts of earthquakes and energy output. |
|
|
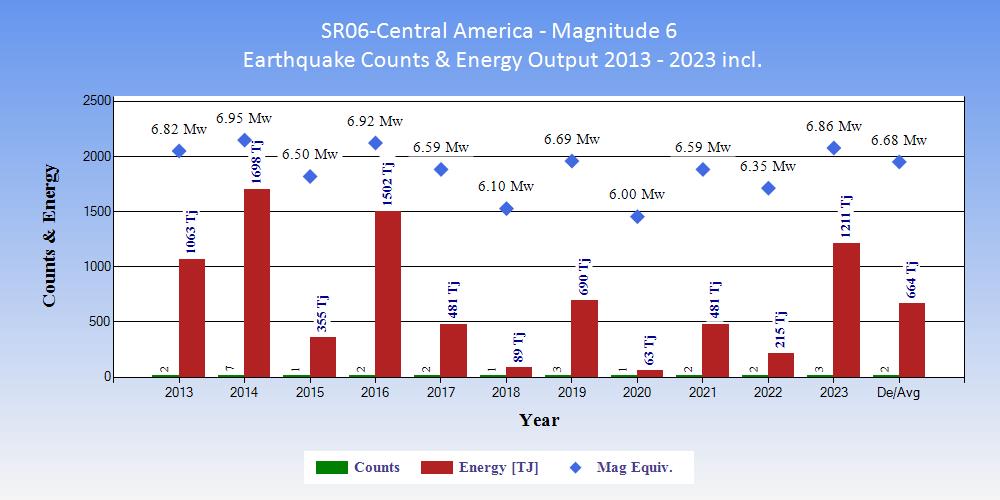
| Tables showing the ranking of 2023 within the 11 years 2013 to 2023 inclusive in terms of counts of earthquakes and energy output. |
|
|
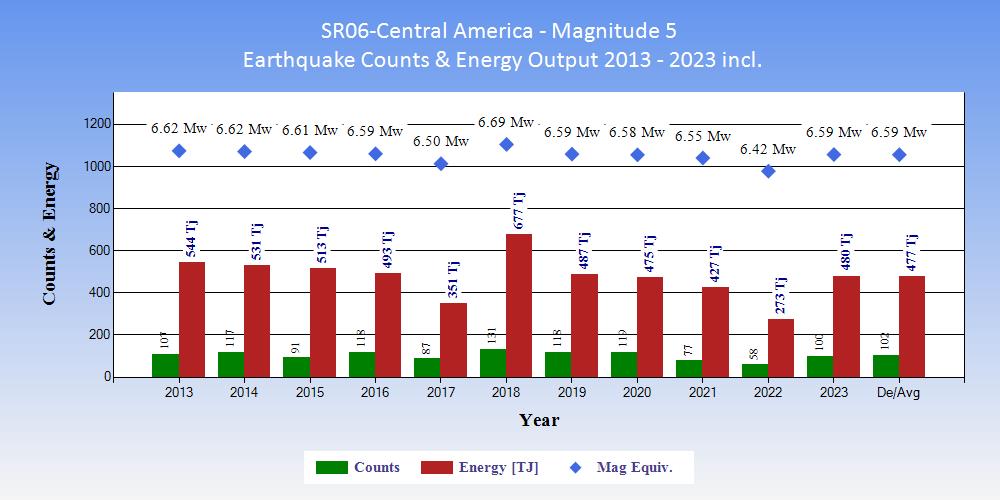
| Tables showing the ranking of 2023 within the 11 years 2013 to 2023 inclusive in terms of counts of earthquakes and energy output. |
|
|
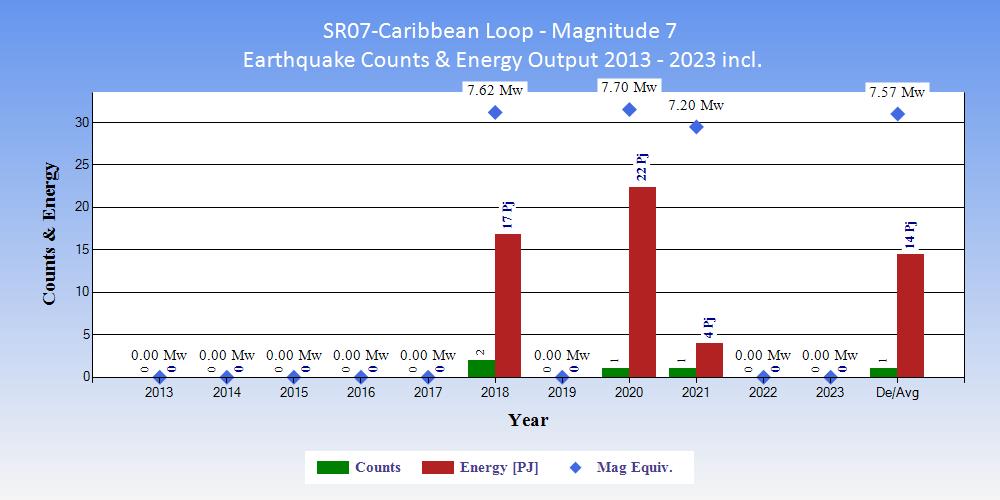
| Tables showing the ranking of 2023 within the 11 years 2013 to 2023 inclusive in terms of counts of earthquakes and energy output. |
|
|
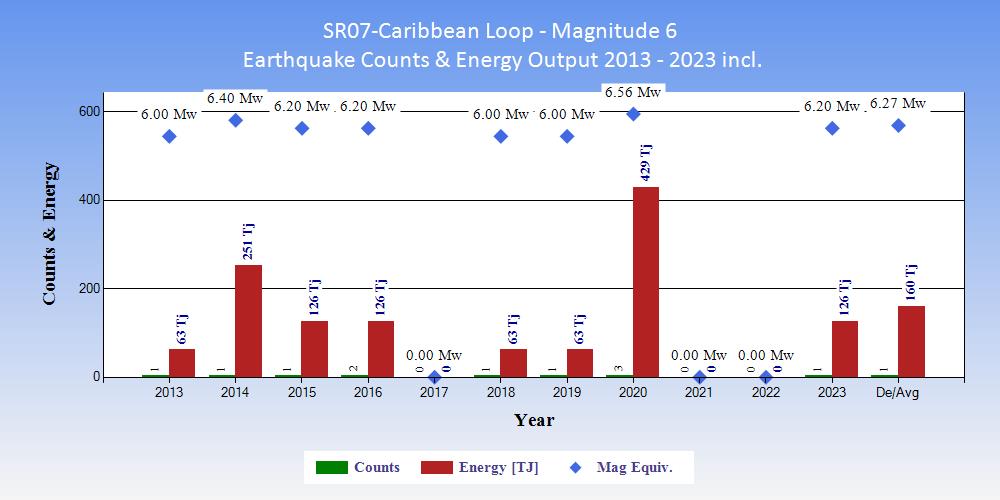
| Tables showing the ranking of 2023 within the 11 years 2013 to 2023 inclusive in terms of counts of earthquakes and energy output. |
|
|
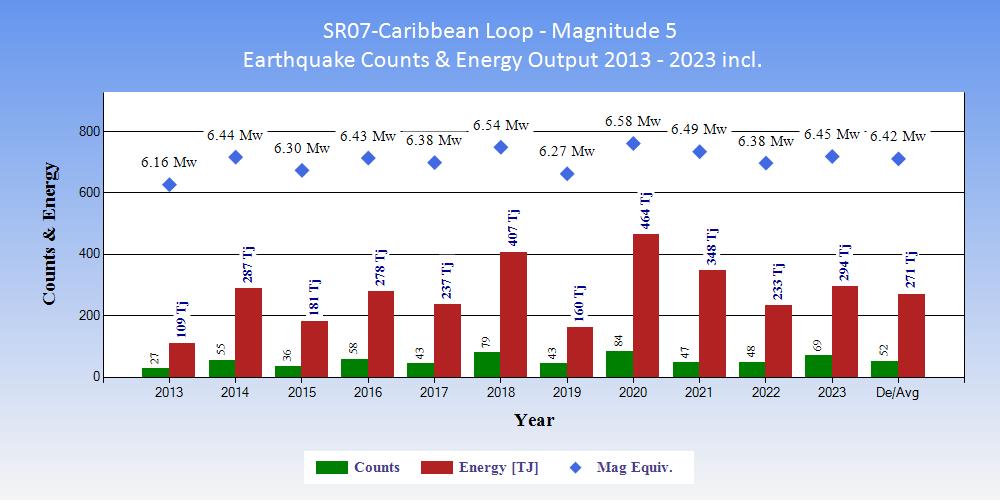
| Tables showing the ranking of 2023 within the 11 years 2013 to 2023 inclusive in terms of counts of earthquakes and energy output. |
|
|
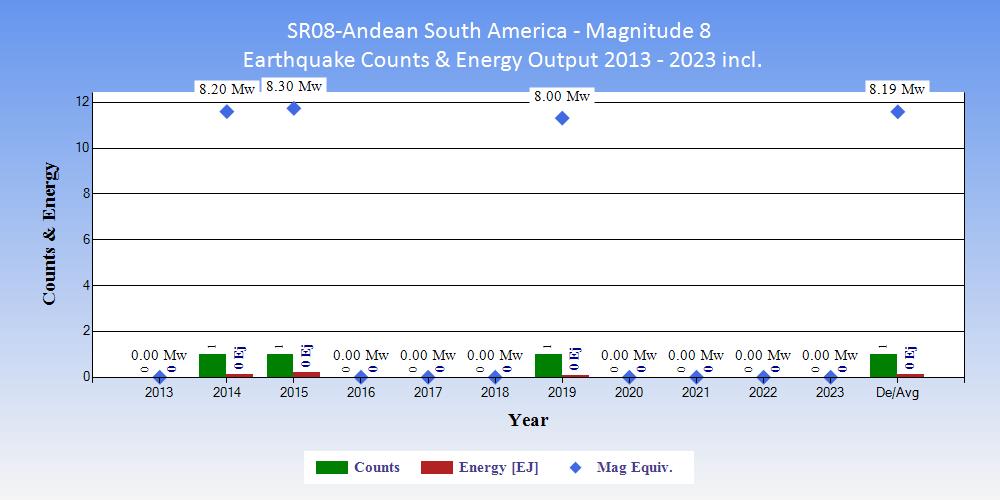
| Tables showing the ranking of 2023 within the 11 years 2013 to 2023 inclusive in terms of counts of earthquakes and energy output. |
|
|
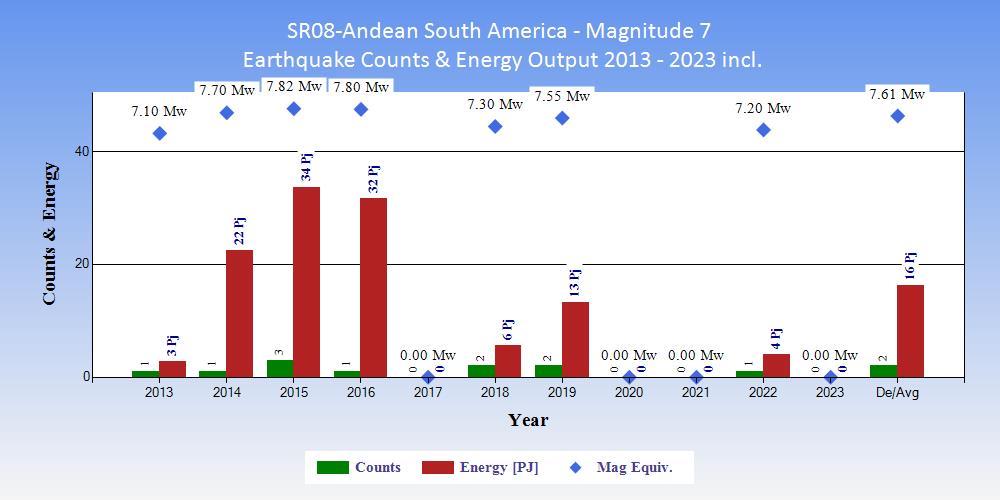
| Tables showing the ranking of 2023 within the 11 years 2013 to 2023 inclusive in terms of counts of earthquakes and energy output. |
|
|
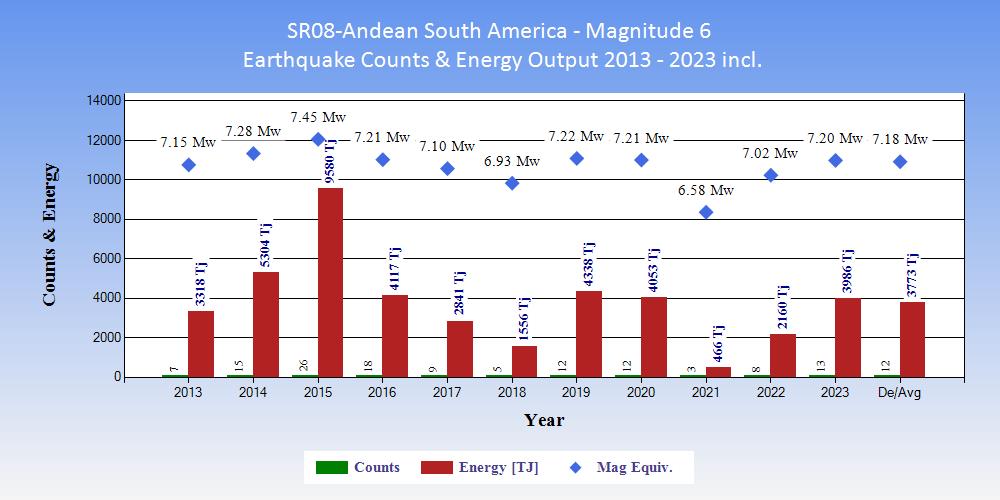
| Tables showing the ranking of 2023 within the 11 years 2013 to 2023 inclusive in terms of counts of earthquakes and energy output. |
|
|
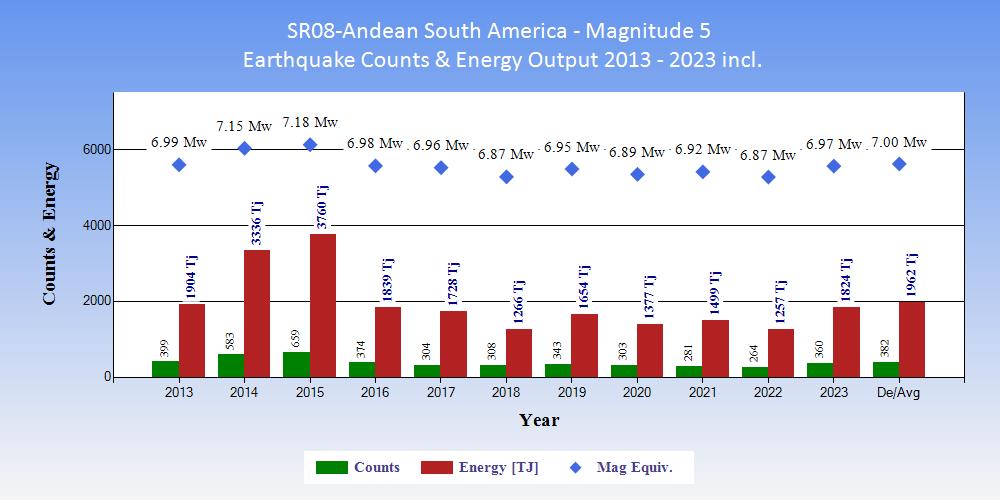
| Tables showing the ranking of 2023 within the 11 years 2013 to 2023 inclusive in terms of counts of earthquakes and energy output. |
|
|
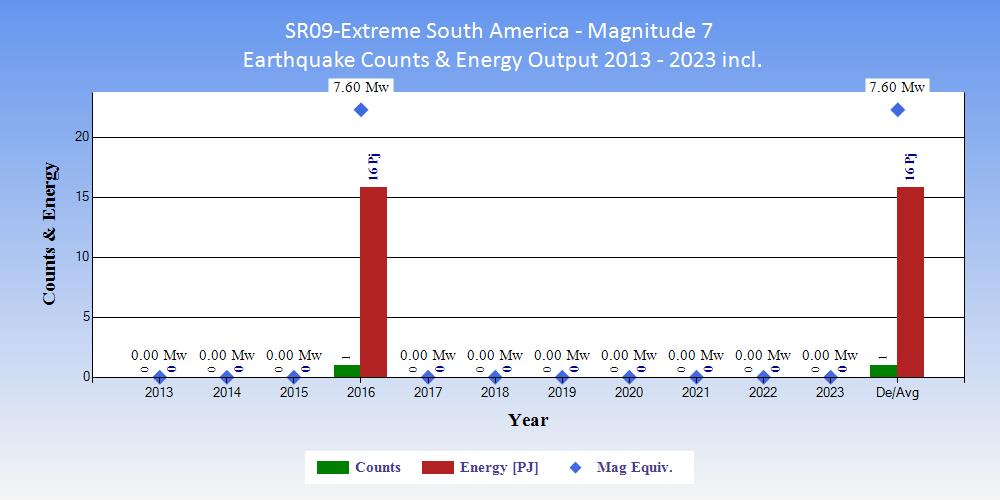
| Tables showing the ranking of 2023 within the 11 years 2013 to 2023 inclusive in terms of counts of earthquakes and energy output. |
|
|
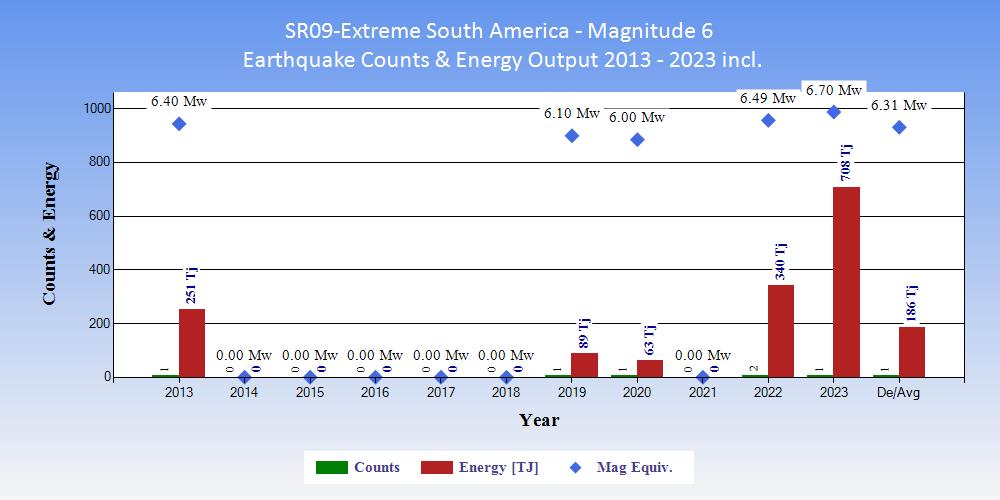
| Tables showing the ranking of 2023 within the 11 years 2013 to 2023 inclusive in terms of counts of earthquakes and energy output. |
|
|
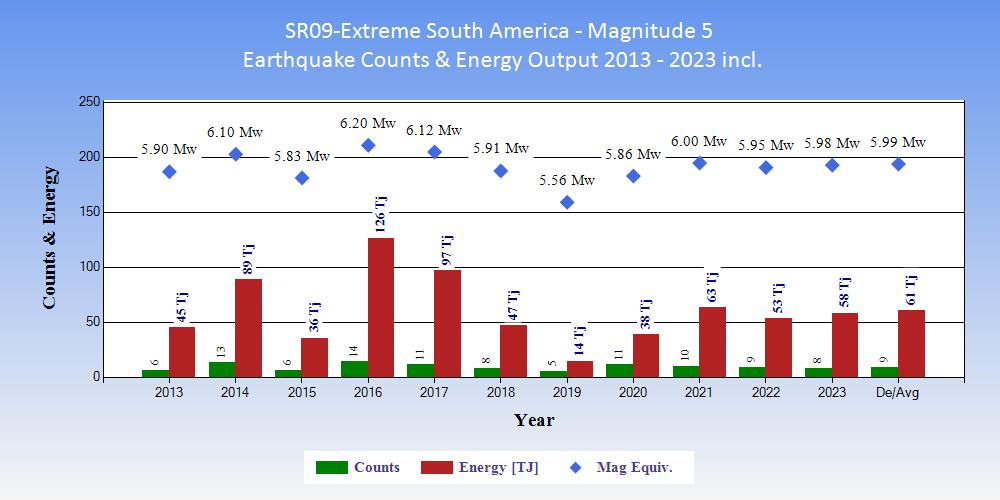
| Tables showing the ranking of 2023 within the 11 years 2013 to 2023 inclusive in terms of counts of earthquakes and energy output. |
|
|
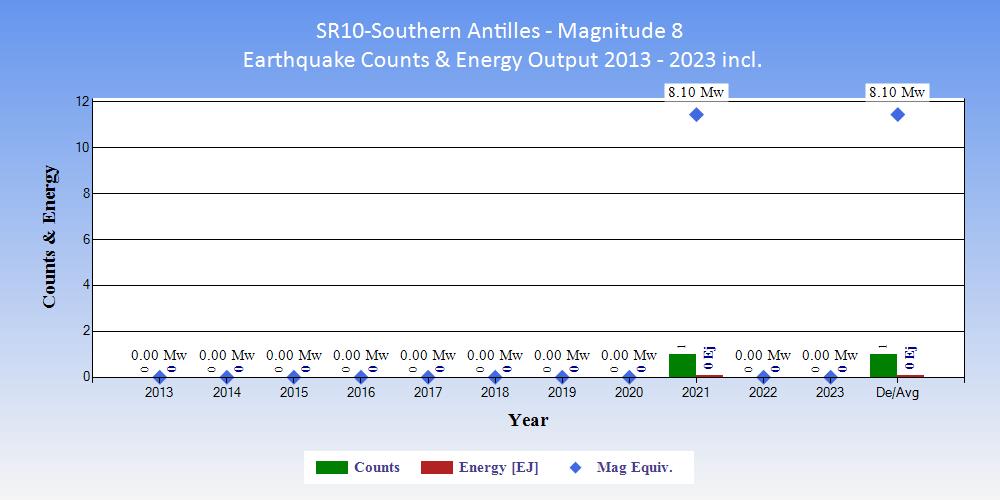
| Tables showing the ranking of 2023 within the 11 years 2013 to 2023 inclusive in terms of counts of earthquakes and energy output. |
|
|
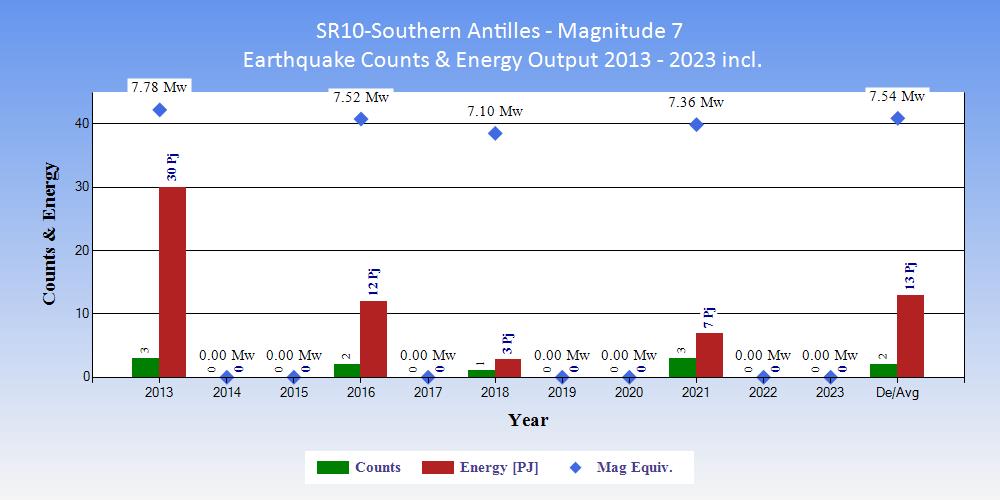
| Tables showing the ranking of 2023 within the 11 years 2013 to 2023 inclusive in terms of counts of earthquakes and energy output. |
|
|
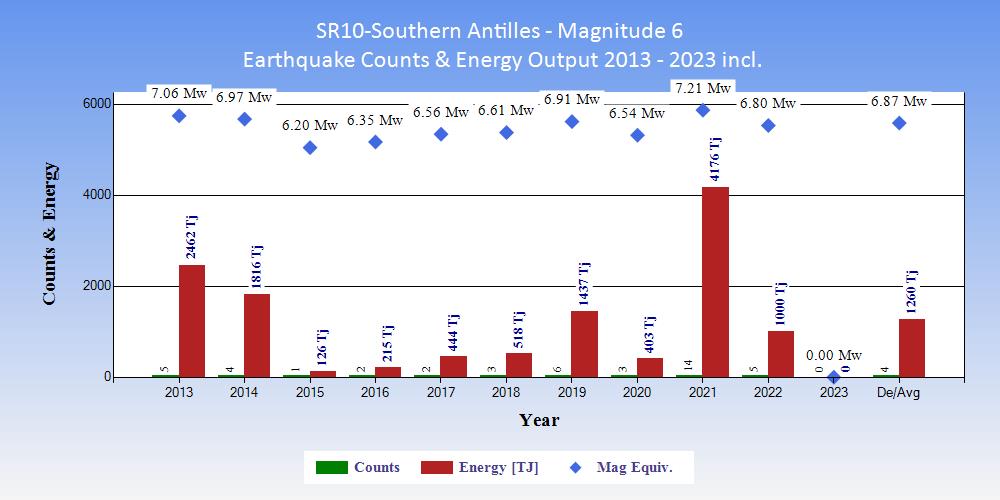
| Tables showing the ranking of 2023 within the 11 years 2013 to 2023 inclusive in terms of counts of earthquakes and energy output. |
|
|
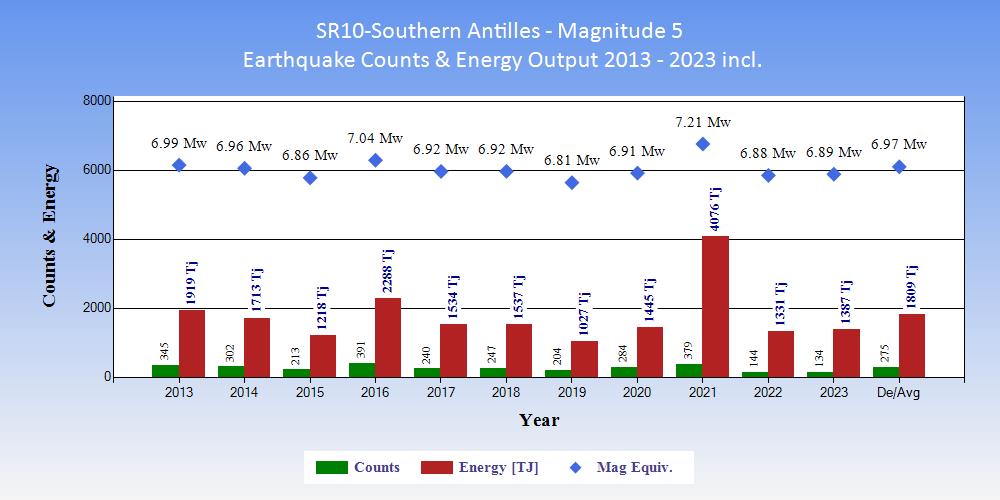
| Tables showing the ranking of 2023 within the 11 years 2013 to 2023 inclusive in terms of counts of earthquakes and energy output. |
|
|
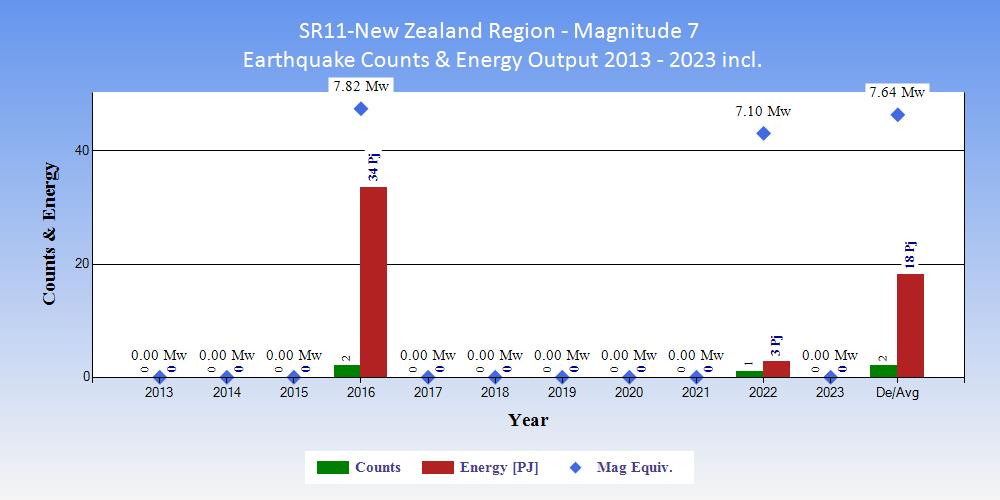
| Tables showing the ranking of 2023 within the 11 years 2013 to 2023 inclusive in terms of counts of earthquakes and energy output. |
|
|
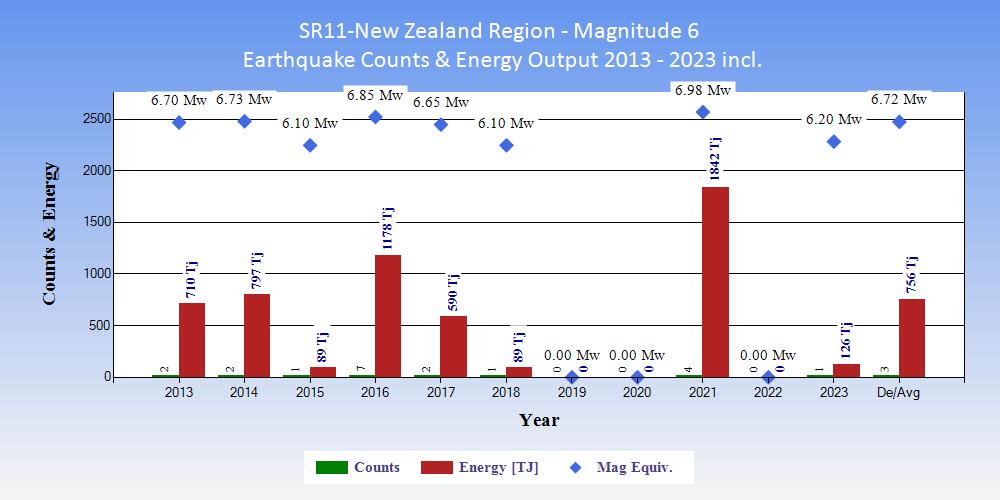
| Tables showing the ranking of 2023 within the 11 years 2013 to 2023 inclusive in terms of counts of earthquakes and energy output. |
|
|
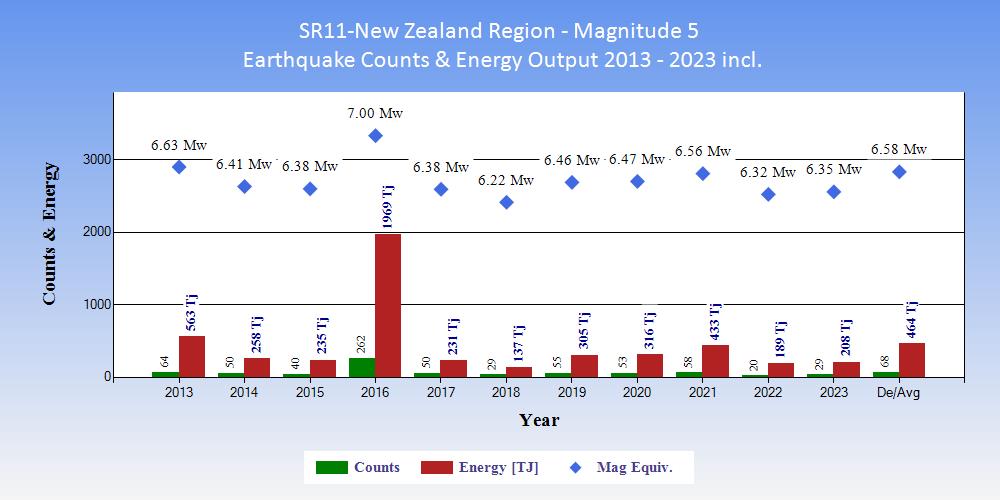
| Tables showing the ranking of 2023 within the 11 years 2013 to 2023 inclusive in terms of counts of earthquakes and energy output. |
|
|
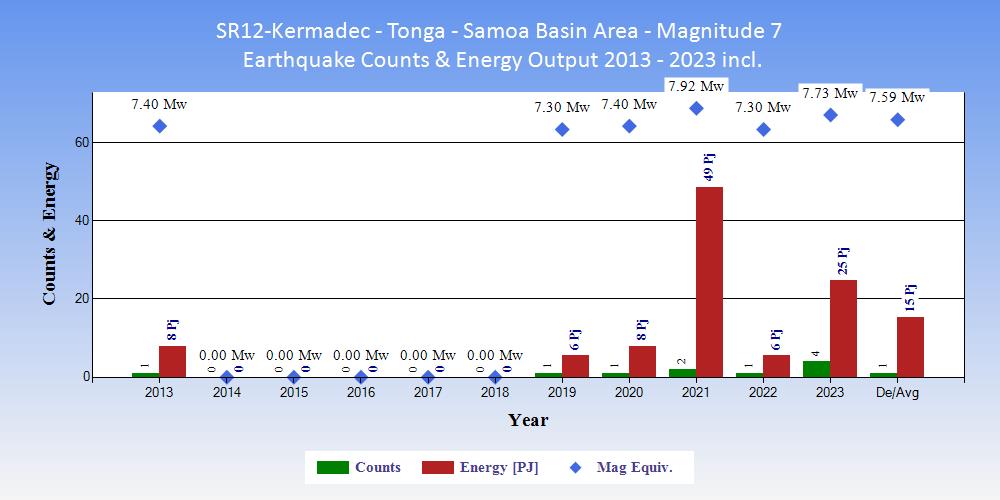
| Tables showing the ranking of 2023 within the 11 years 2013 to 2023 inclusive in terms of counts of earthquakes and energy output. |
|
|
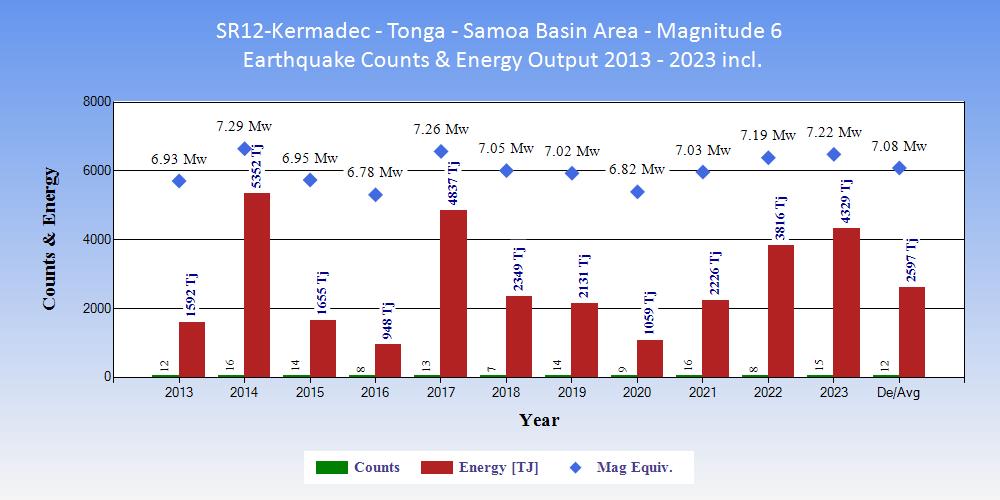
| Tables showing the ranking of 2023 within the 11 years 2013 to 2023 inclusive in terms of counts of earthquakes and energy output. |
|
|
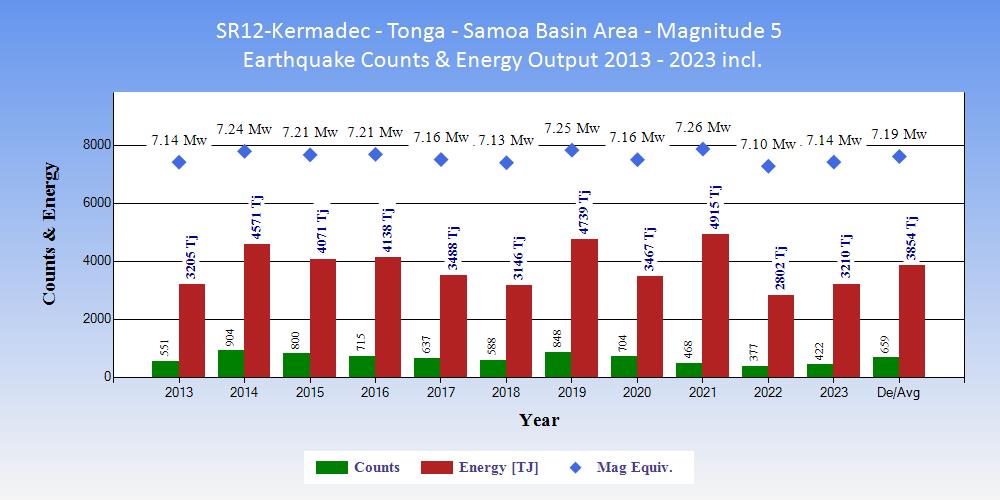
| Tables showing the ranking of 2023 within the 11 years 2013 to 2023 inclusive in terms of counts of earthquakes and energy output. |
|
|
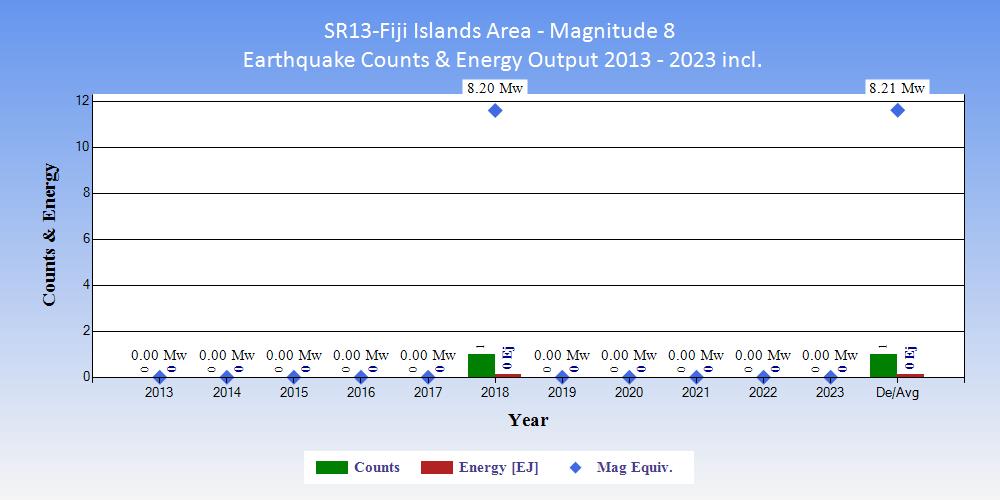
| Tables showing the ranking of 2023 within the 11 years 2013 to 2023 inclusive in terms of counts of earthquakes and energy output. |
|
|
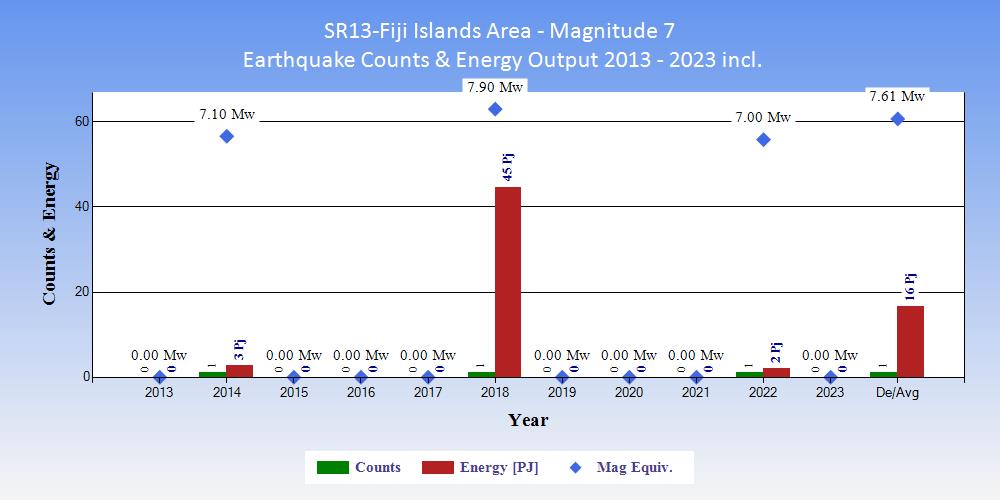
| Tables showing the ranking of 2023 within the 11 years 2013 to 2023 inclusive in terms of counts of earthquakes and energy output. |
|
|
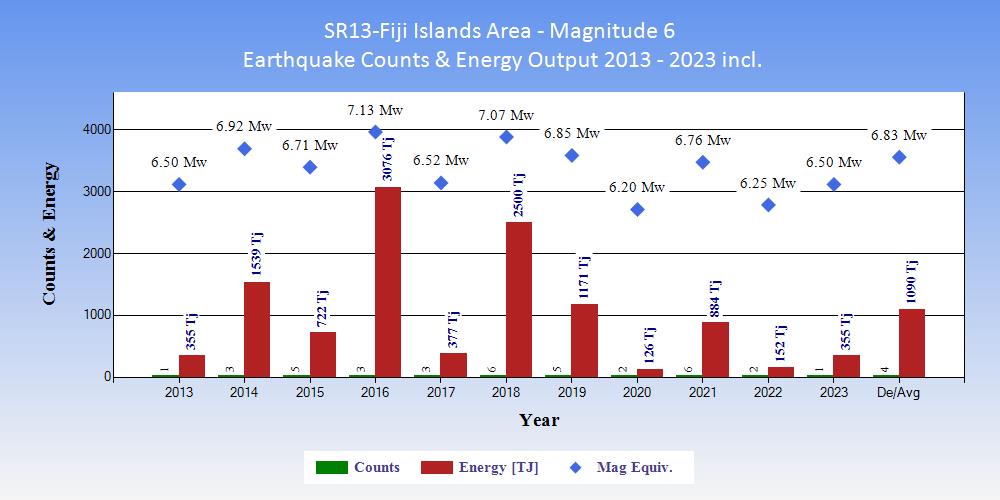
| Tables showing the ranking of 2023 within the 11 years 2013 to 2023 inclusive in terms of counts of earthquakes and energy output. |
|
|
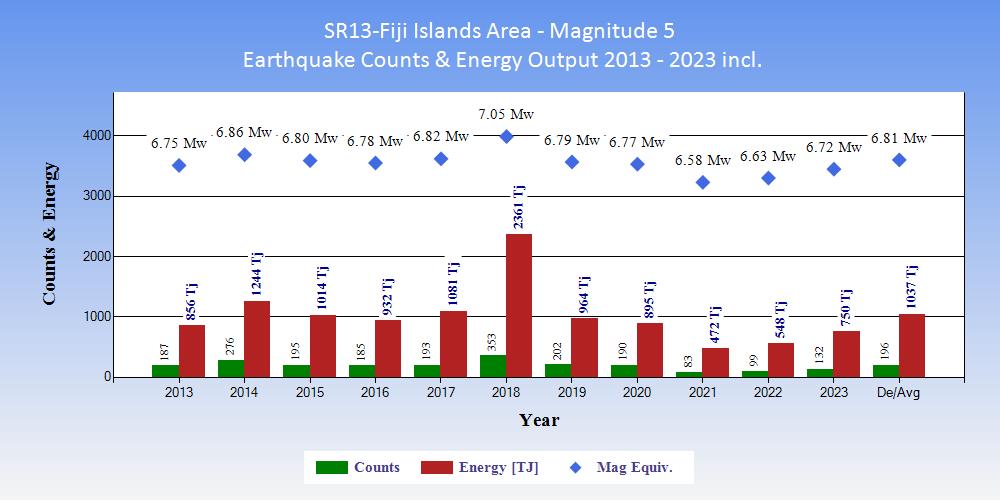
| Tables showing the ranking of 2023 within the 11 years 2013 to 2023 inclusive in terms of counts of earthquakes and energy output. |
|
|
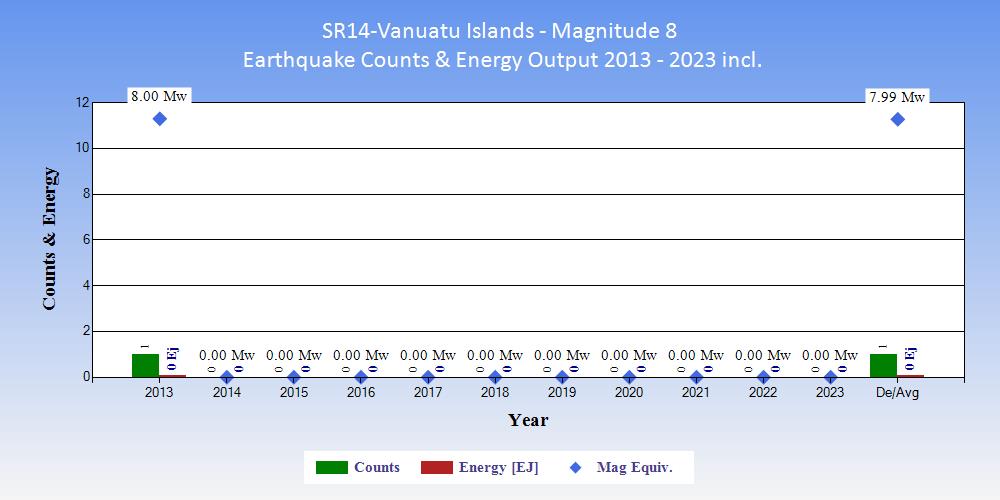
| Tables showing the ranking of 2023 within the 11 years 2013 to 2023 inclusive in terms of counts of earthquakes and energy output. |
|
|
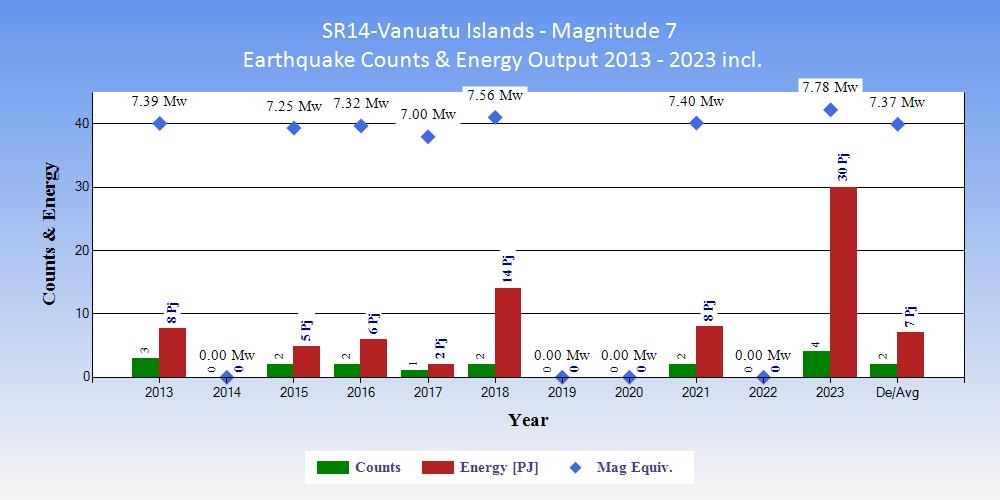
| Tables showing the ranking of 2023 within the 11 years 2013 to 2023 inclusive in terms of counts of earthquakes and energy output. |
|
|
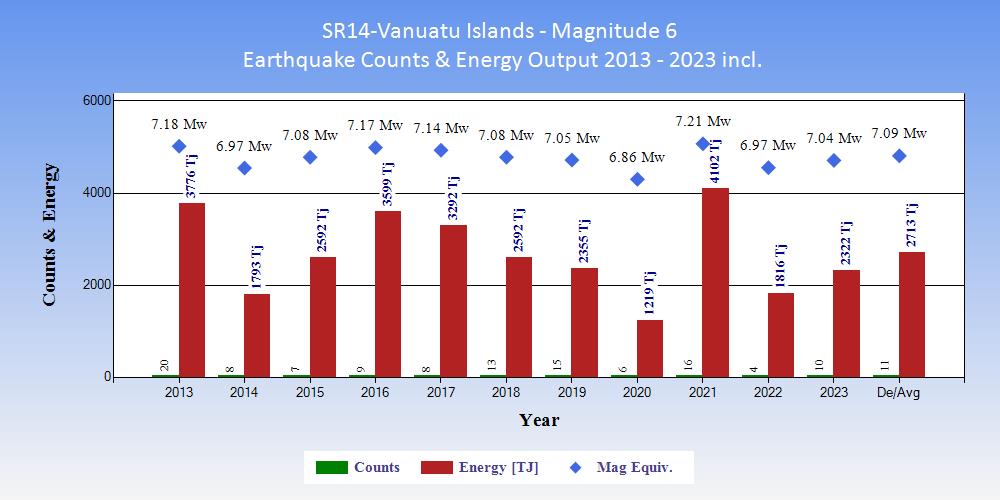
| Tables showing the ranking of 2023 within the 11 years 2013 to 2023 inclusive in terms of counts of earthquakes and energy output. |
|
|
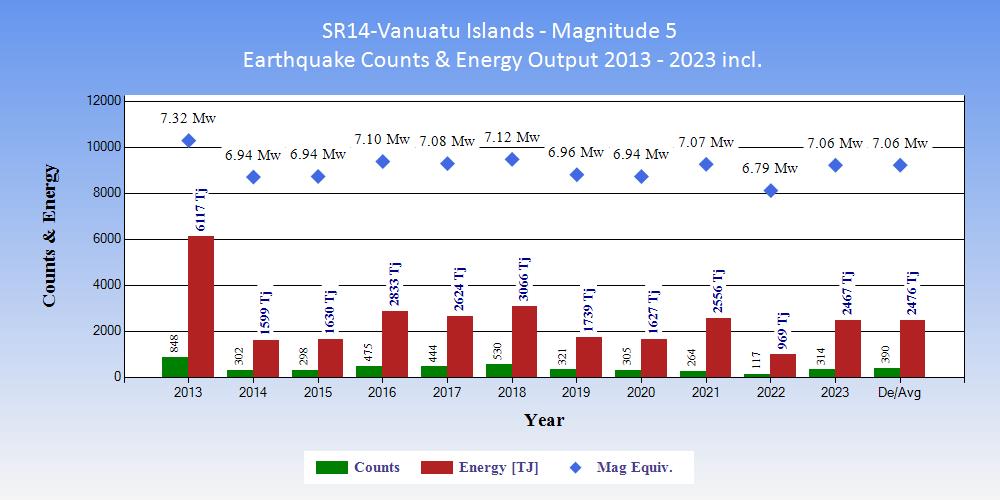
| Tables showing the ranking of 2023 within the 11 years 2013 to 2023 inclusive in terms of counts of earthquakes and energy output. |
|
|
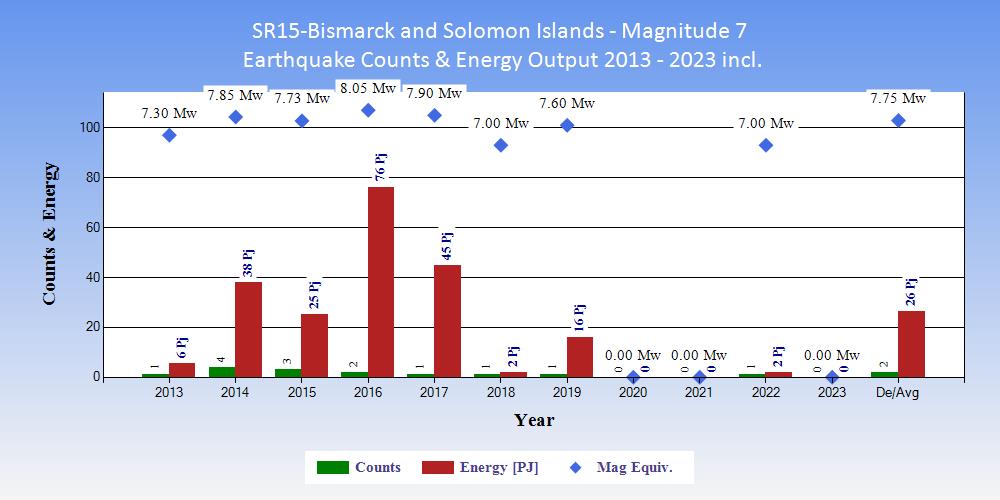
| Tables showing the ranking of 2023 within the 11 years 2013 to 2023 inclusive in terms of counts of earthquakes and energy output. |
|
|
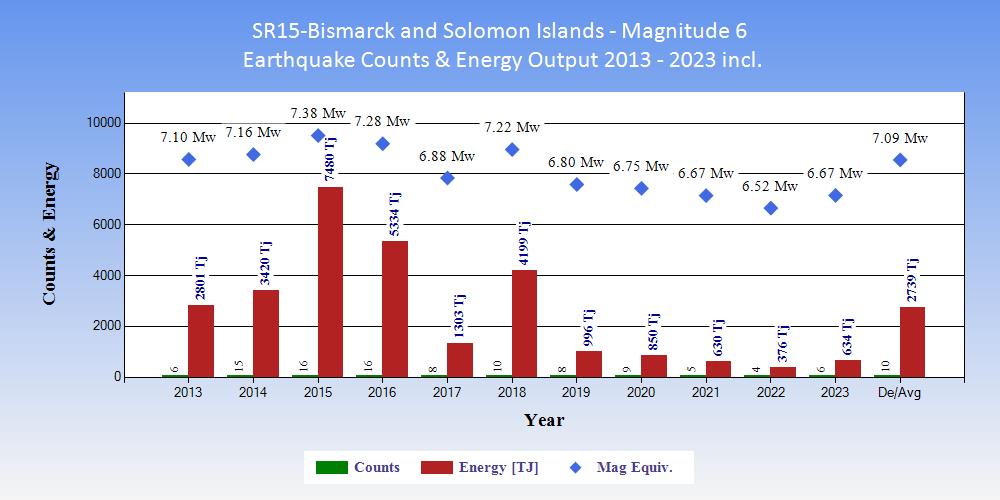
| Tables showing the ranking of 2023 within the 11 years 2013 to 2023 inclusive in terms of counts of earthquakes and energy output. |
|
|
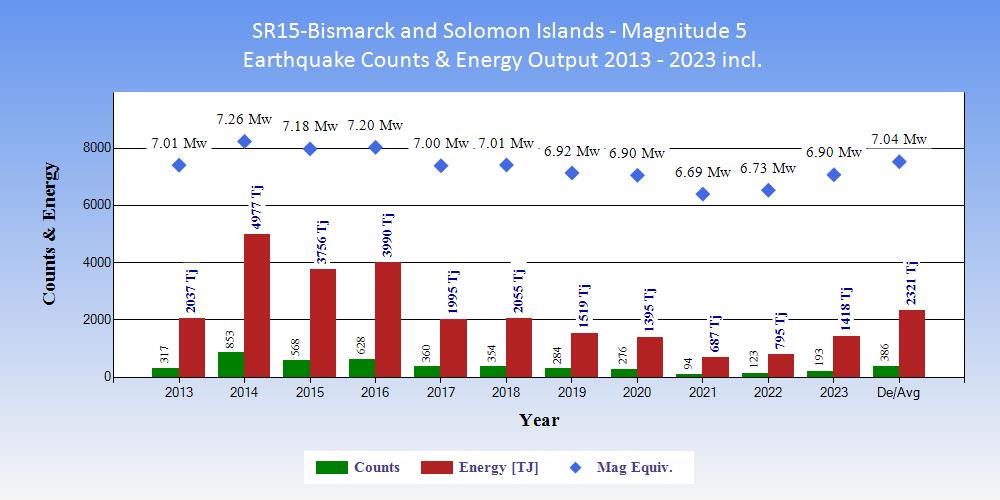
| Tables showing the ranking of 2023 within the 11 years 2013 to 2023 inclusive in terms of counts of earthquakes and energy output. |
|
|
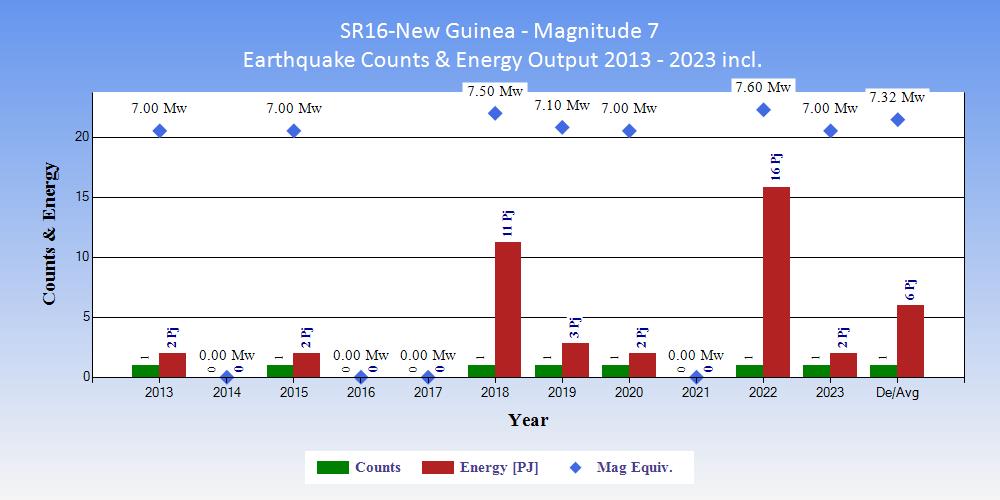
| Tables showing the ranking of 2023 within the 11 years 2013 to 2023 inclusive in terms of counts of earthquakes and energy output. |
|
|
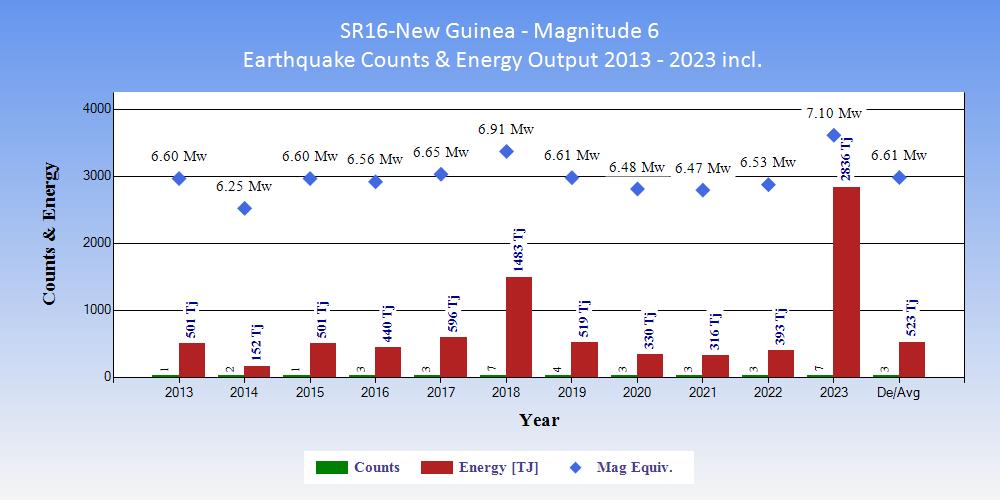
| Tables showing the ranking of 2023 within the 11 years 2013 to 2023 inclusive in terms of counts of earthquakes and energy output. |
|
|
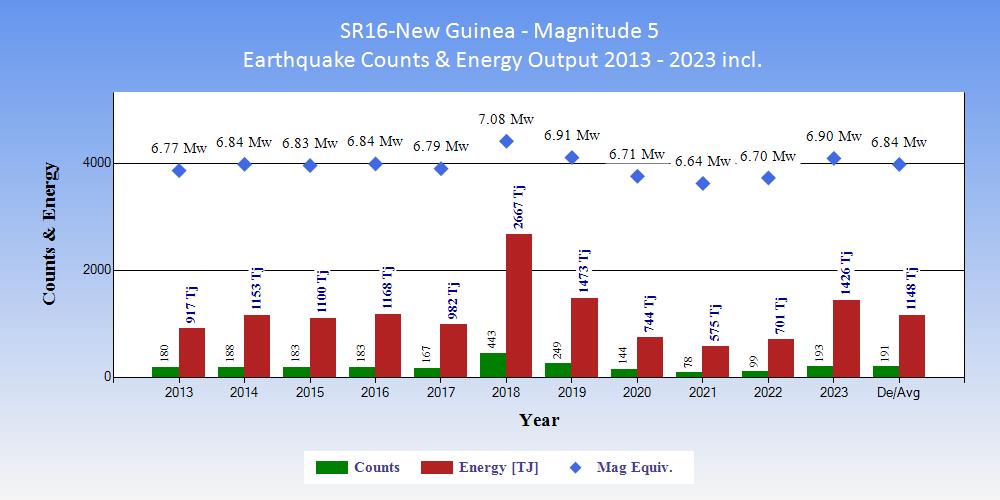
| Tables showing the ranking of 2023 within the 11 years 2013 to 2023 inclusive in terms of counts of earthquakes and energy output. |
|
|
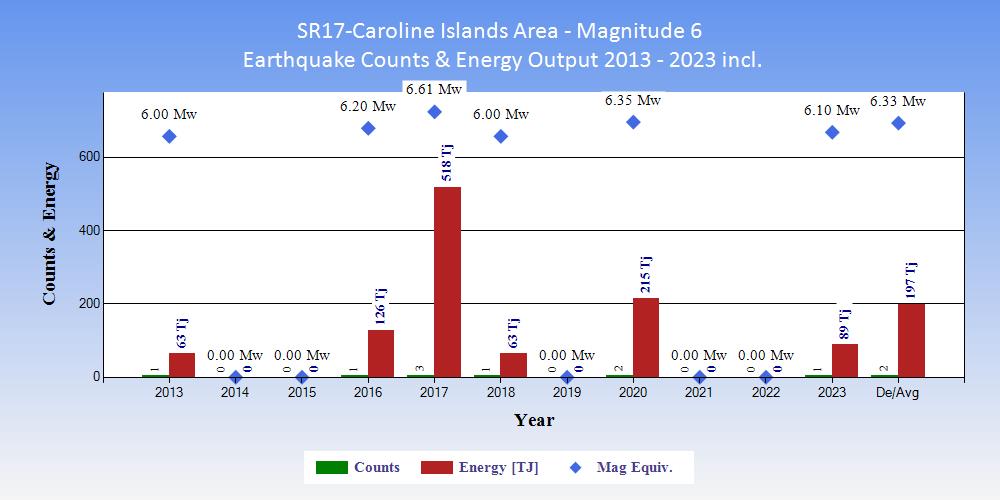
| Tables showing the ranking of 2023 within the 11 years 2013 to 2023 inclusive in terms of counts of earthquakes and energy output. |
|
|
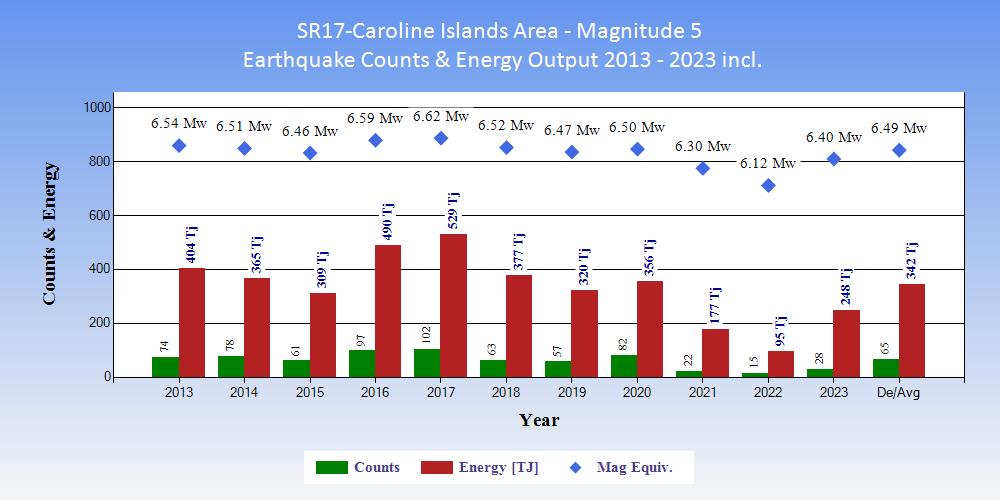
| Tables showing the ranking of 2023 within the 11 years 2013 to 2023 inclusive in terms of counts of earthquakes and energy output. |
|
|
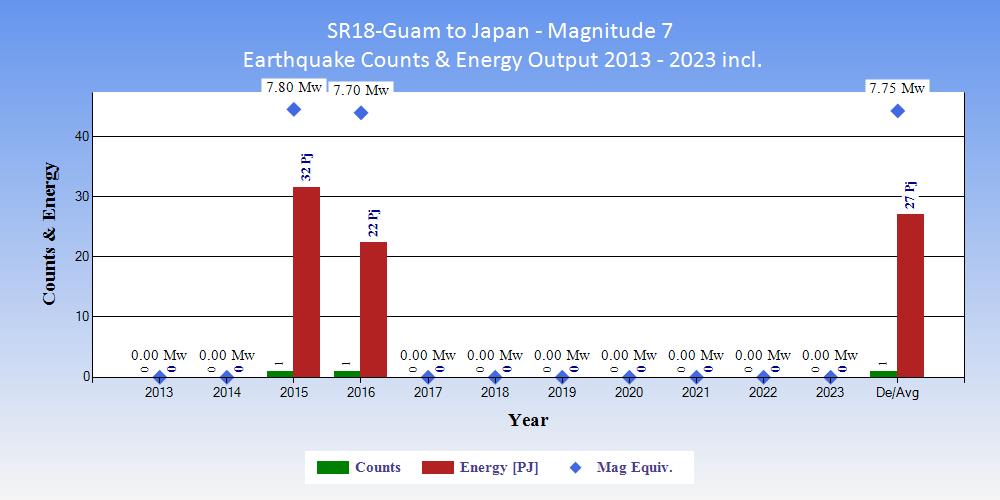
| Tables showing the ranking of 2023 within the 11 years 2013 to 2023 inclusive in terms of counts of earthquakes and energy output. |
|
|
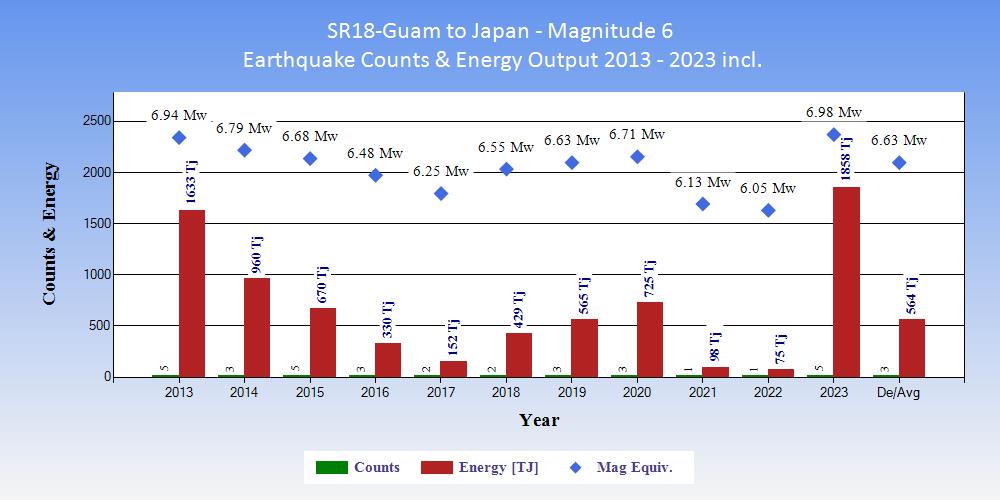
| Tables showing the ranking of 2023 within the 11 years 2013 to 2023 inclusive in terms of counts of earthquakes and energy output. |
|
|
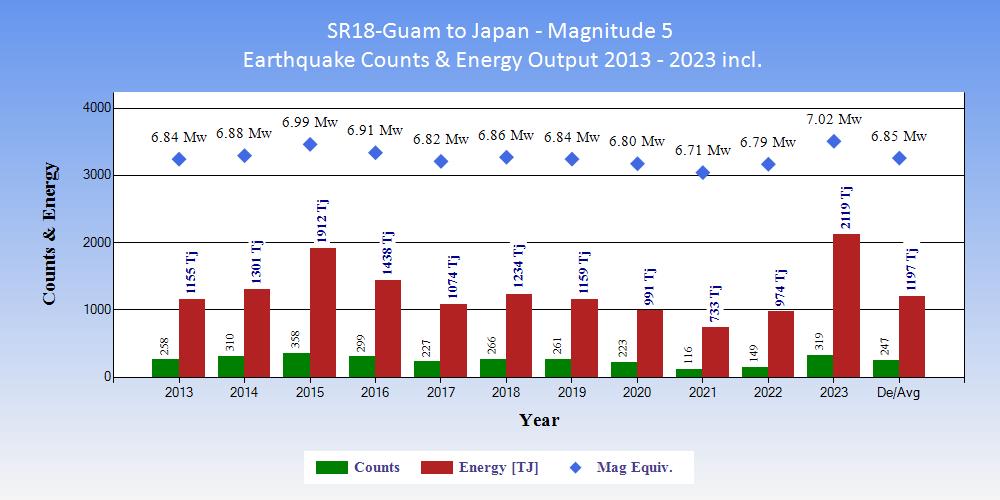
| Tables showing the ranking of 2023 within the 11 years 2013 to 2023 inclusive in terms of counts of earthquakes and energy output. |
|
|
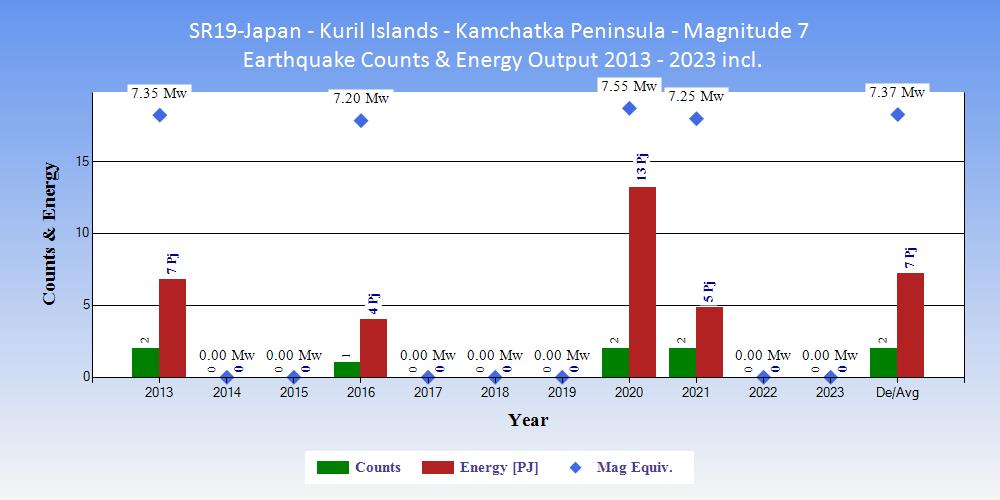
| Tables showing the ranking of 2023 within the 11 years 2013 to 2023 inclusive in terms of counts of earthquakes and energy output. |
|
|
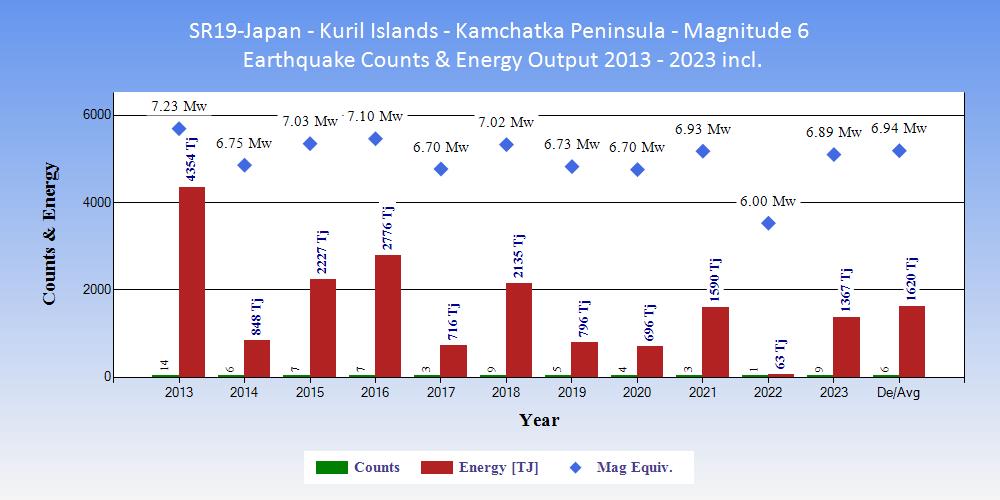
| Tables showing the ranking of 2023 within the 11 years 2013 to 2023 inclusive in terms of counts of earthquakes and energy output. |
|
|
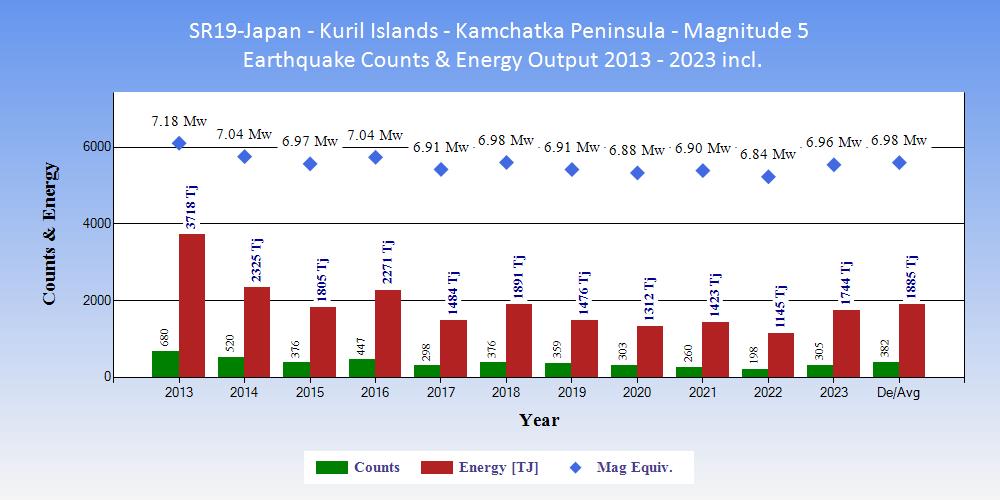
| Tables showing the ranking of 2023 within the 11 years 2013 to 2023 inclusive in terms of counts of earthquakes and energy output. |
|
|
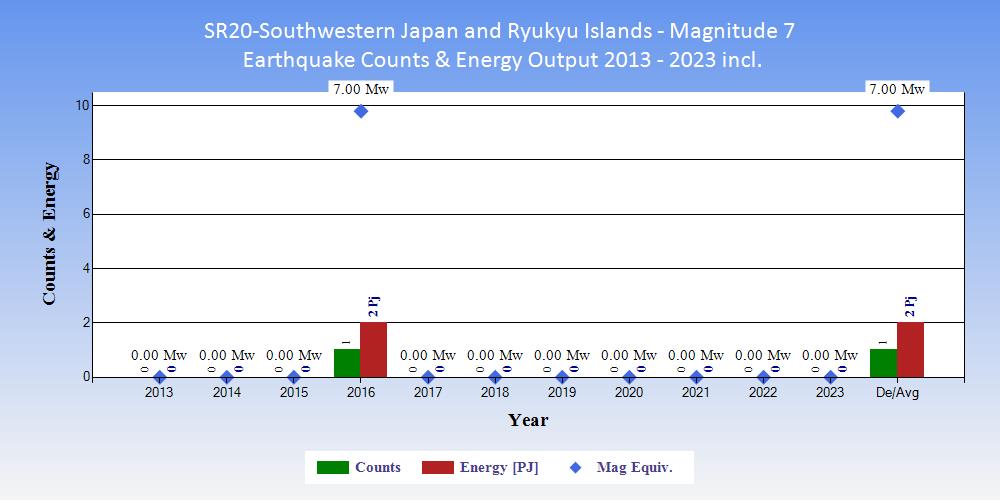
| Tables showing the ranking of 2023 within the 11 years 2013 to 2023 inclusive in terms of counts of earthquakes and energy output. |
|
|
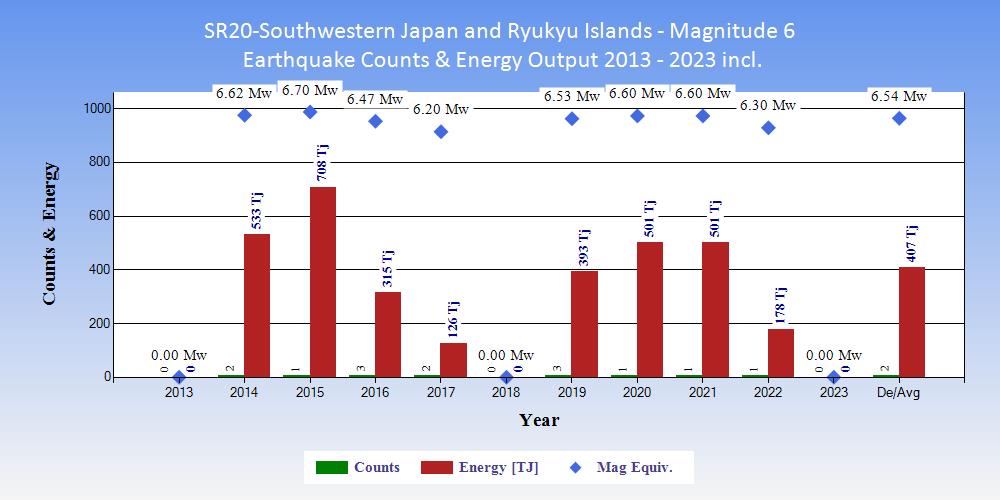
| Tables showing the ranking of 2023 within the 11 years 2013 to 2023 inclusive in terms of counts of earthquakes and energy output. |
|
|
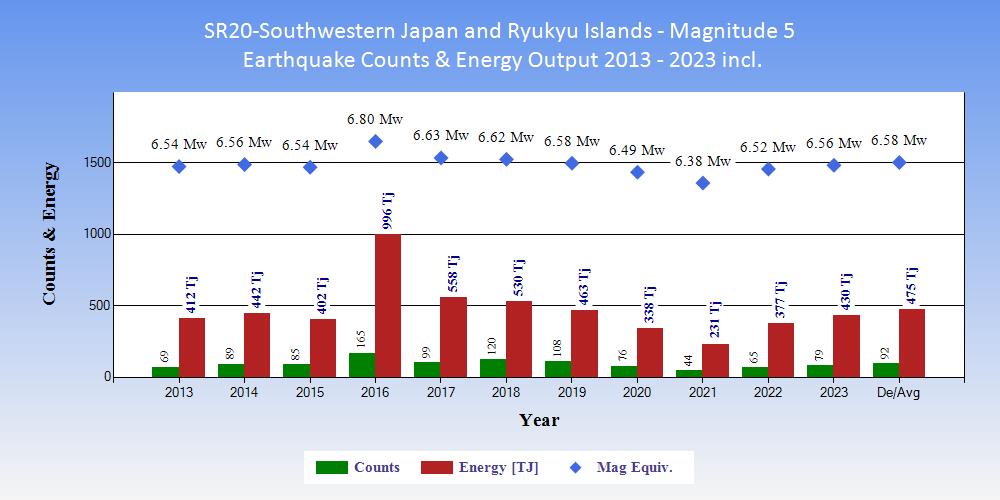
| Tables showing the ranking of 2023 within the 11 years 2013 to 2023 inclusive in terms of counts of earthquakes and energy output. |
|
|
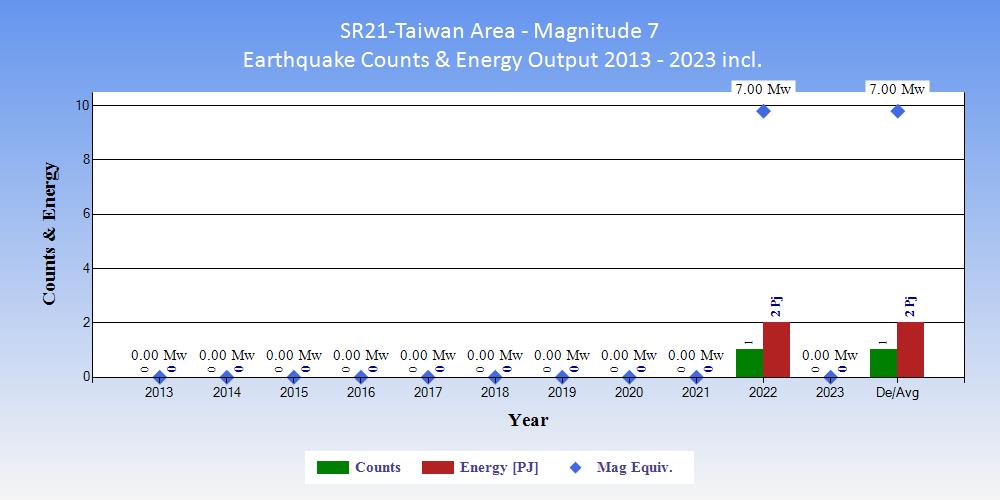
| Tables showing the ranking of 2023 within the 11 years 2013 to 2023 inclusive in terms of counts of earthquakes and energy output. |
|
|
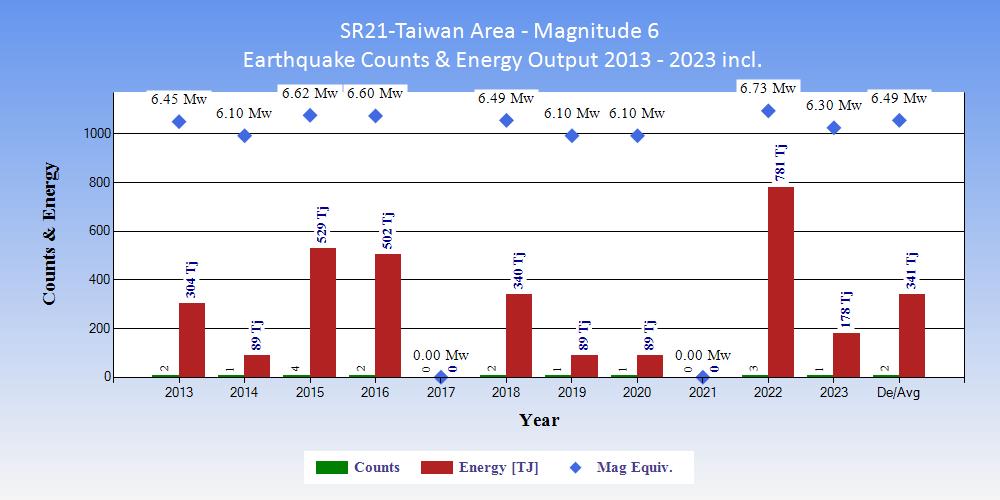
| Tables showing the ranking of 2023 within the 11 years 2013 to 2023 inclusive in terms of counts of earthquakes and energy output. |
|
|
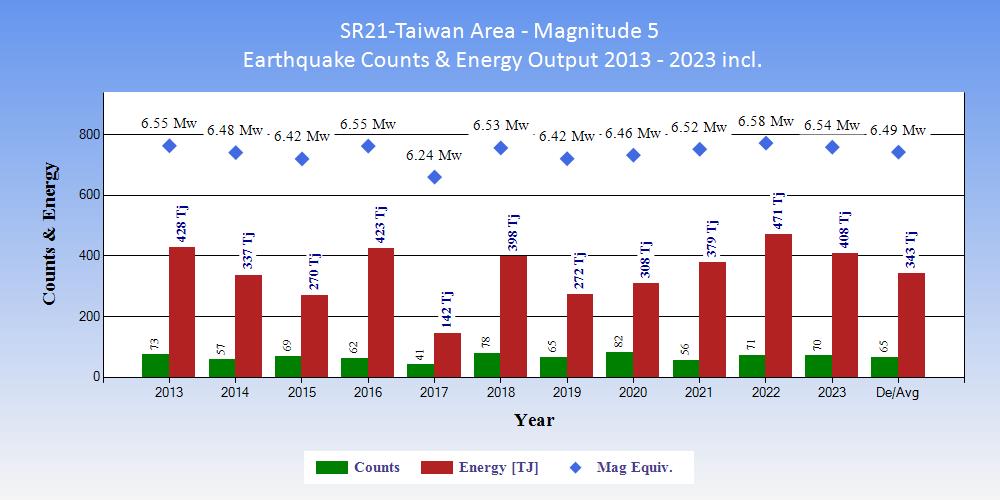
| Tables showing the ranking of 2023 within the 11 years 2013 to 2023 inclusive in terms of counts of earthquakes and energy output. |
|
|
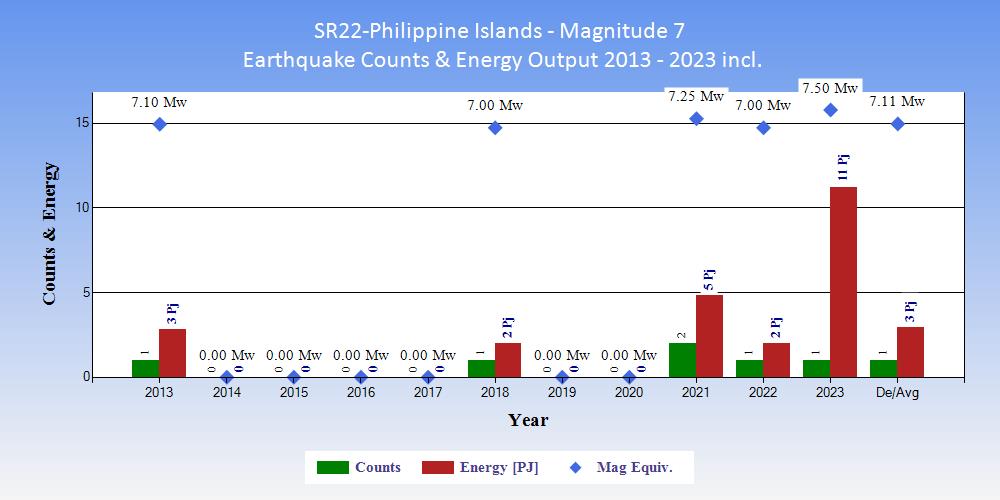
| Tables showing the ranking of 2023 within the 11 years 2013 to 2023 inclusive in terms of counts of earthquakes and energy output. |
|
|
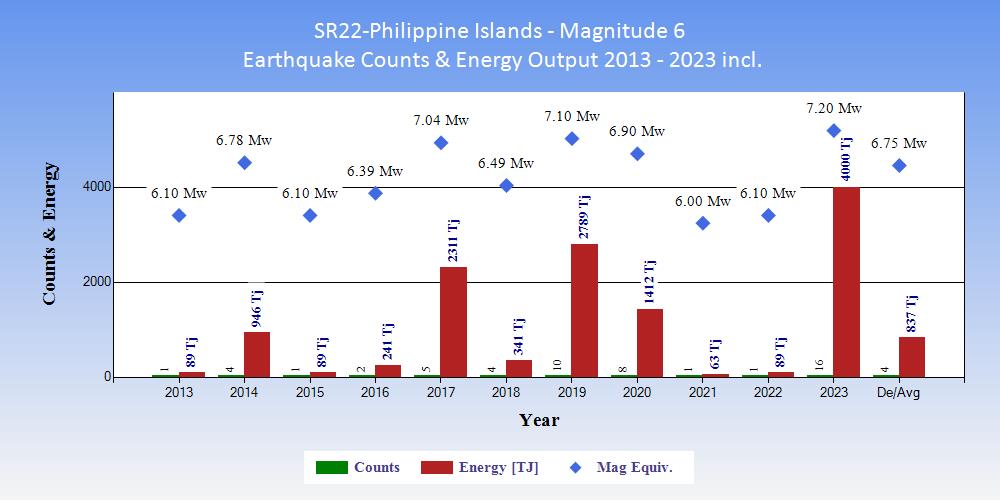
| Tables showing the ranking of 2023 within the 11 years 2013 to 2023 inclusive in terms of counts of earthquakes and energy output. |
|
|
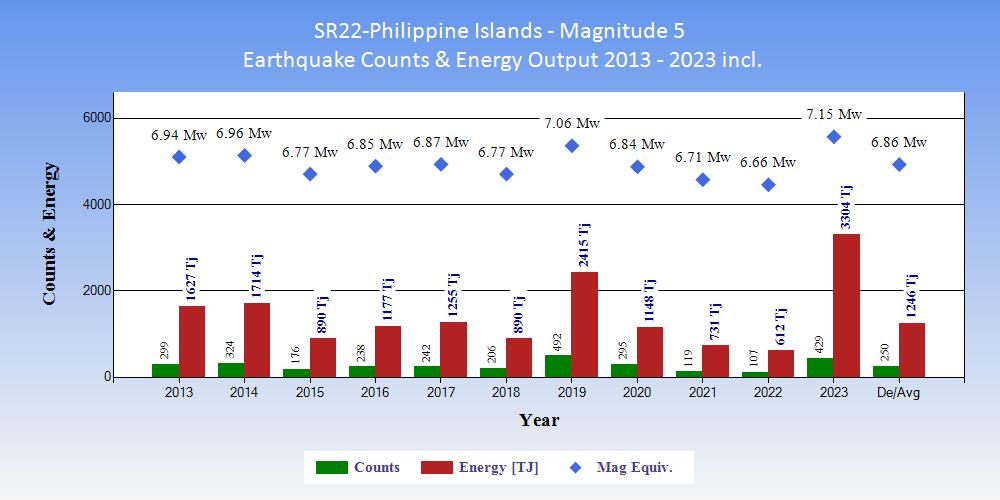
| Tables showing the ranking of 2023 within the 11 years 2013 to 2023 inclusive in terms of counts of earthquakes and energy output. |
|
|
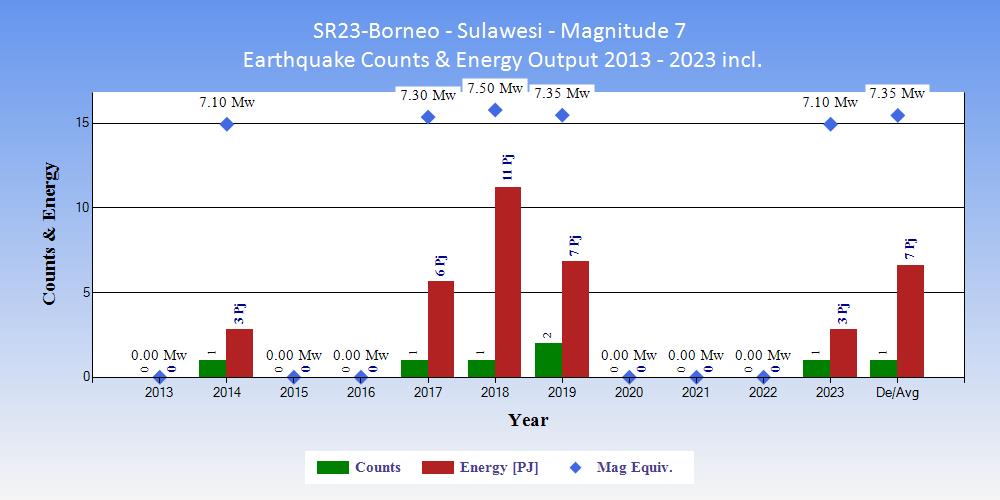
| Tables showing the ranking of 2023 within the 11 years 2013 to 2023 inclusive in terms of counts of earthquakes and energy output. |
|
|
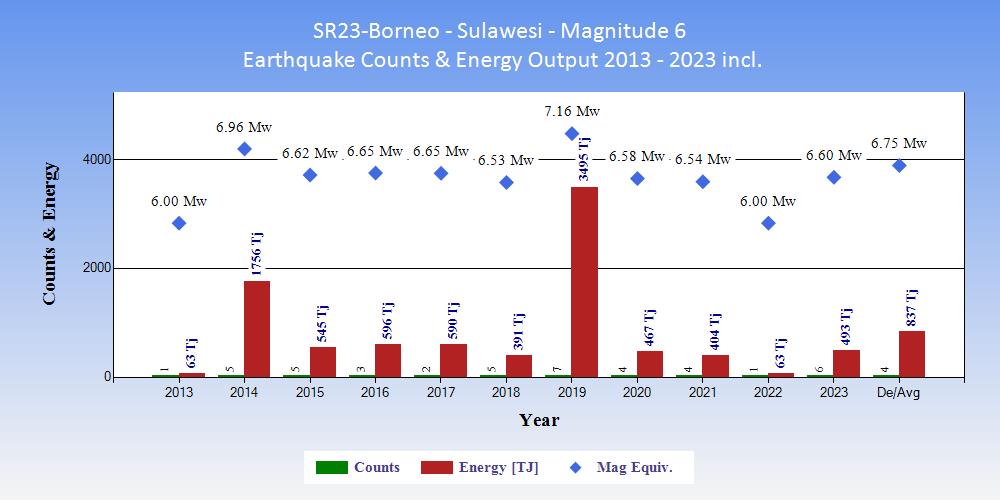
| Tables showing the ranking of 2023 within the 11 years 2013 to 2023 inclusive in terms of counts of earthquakes and energy output. |
|
|
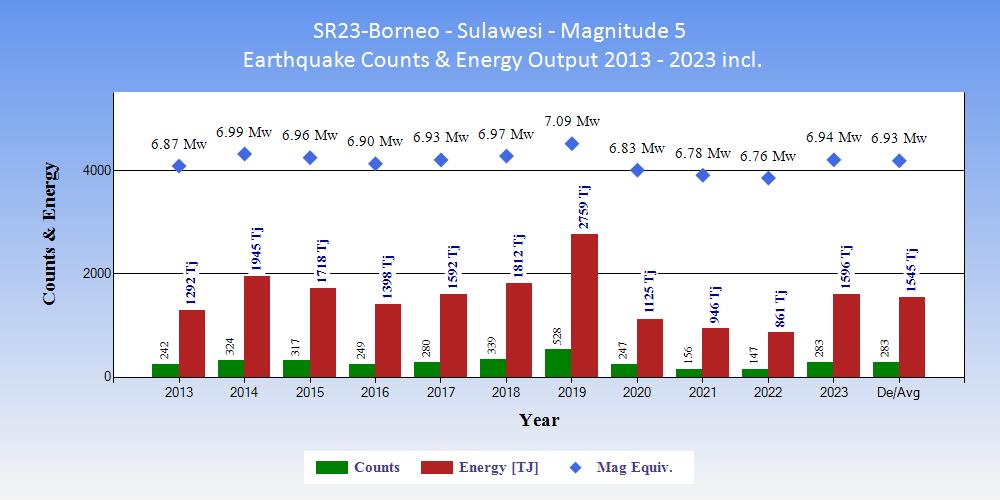
| Tables showing the ranking of 2023 within the 11 years 2013 to 2023 inclusive in terms of counts of earthquakes and energy output. |
|
|
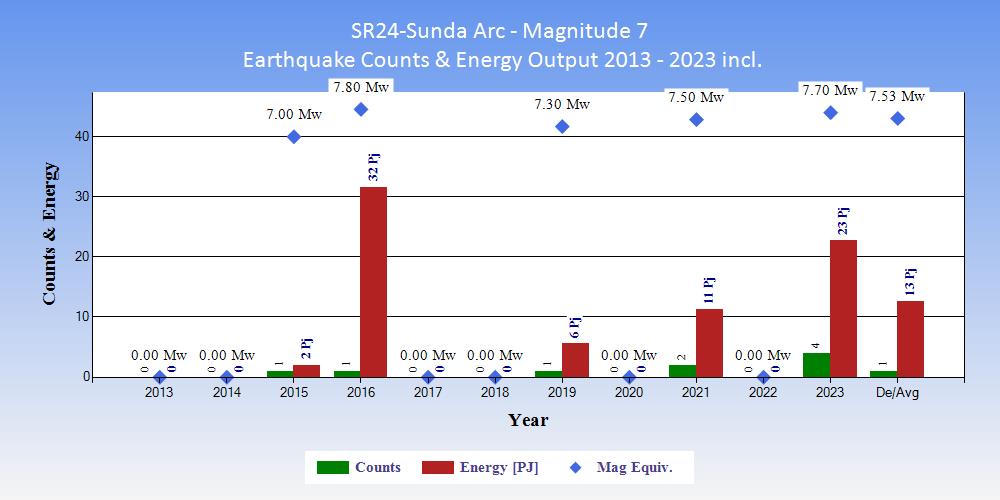
| Tables showing the ranking of 2023 within the 11 years 2013 to 2023 inclusive in terms of counts of earthquakes and energy output. |
|
|
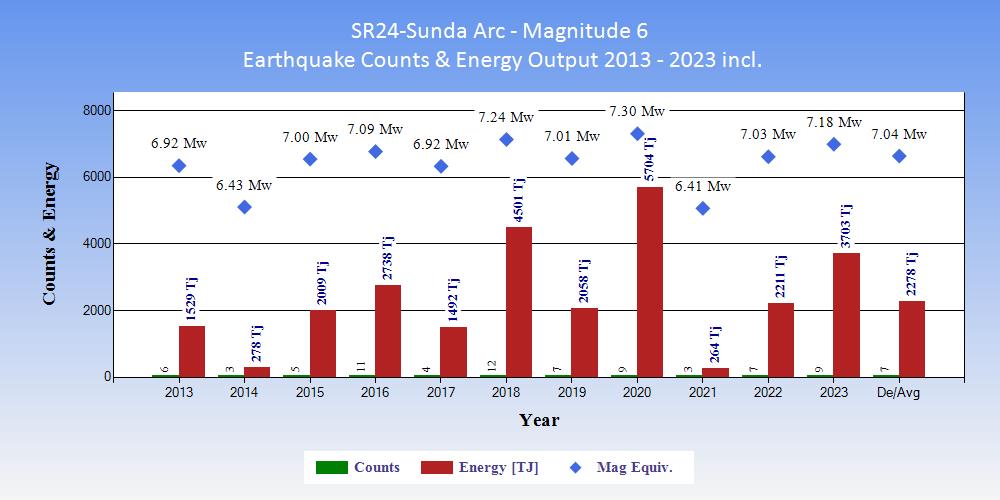
| Tables showing the ranking of 2023 within the 11 years 2013 to 2023 inclusive in terms of counts of earthquakes and energy output. |
|
|
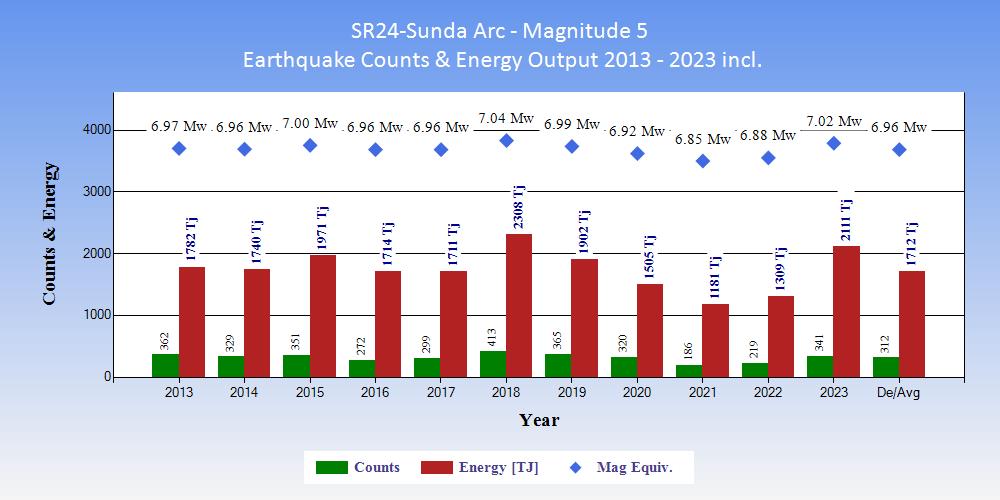
| Tables showing the ranking of 2023 within the 11 years 2013 to 2023 inclusive in terms of counts of earthquakes and energy output. |
|
|
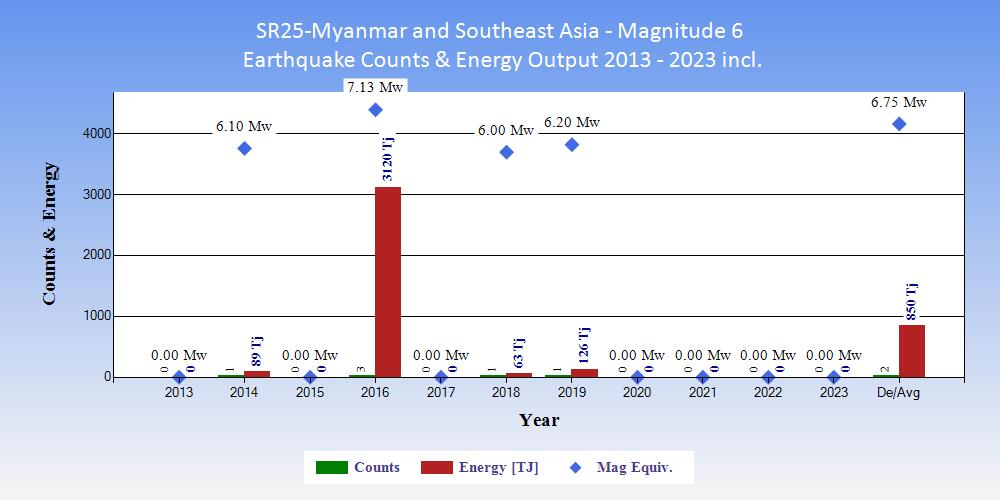
| Tables showing the ranking of 2023 within the 11 years 2013 to 2023 inclusive in terms of counts of earthquakes and energy output. |
|
|
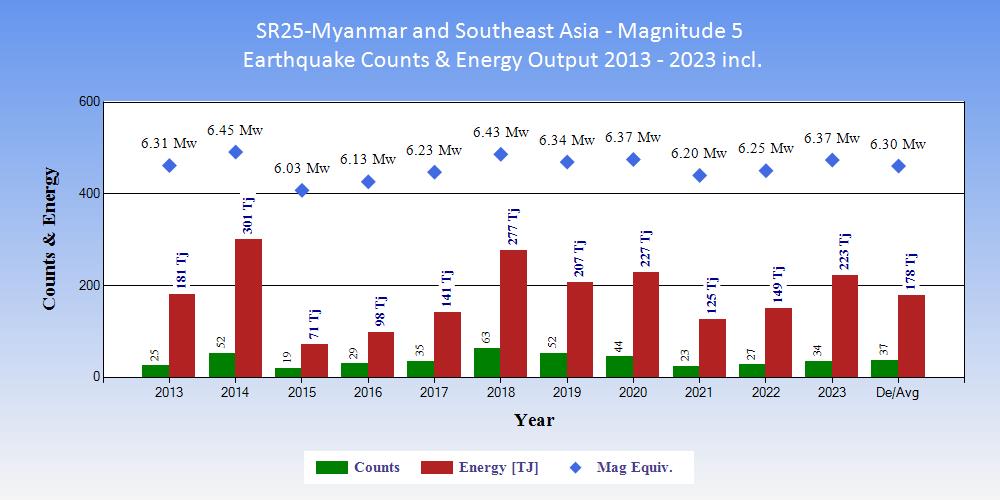
| Tables showing the ranking of 2023 within the 11 years 2013 to 2023 inclusive in terms of counts of earthquakes and energy output. |
|
|
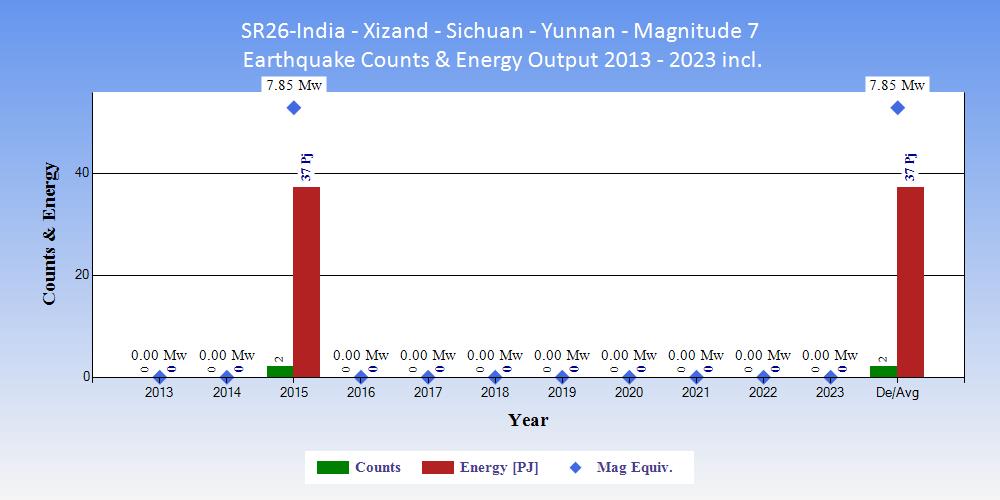
| Tables showing the ranking of 2023 within the 11 years 2013 to 2023 inclusive in terms of counts of earthquakes and energy output. |
|
|
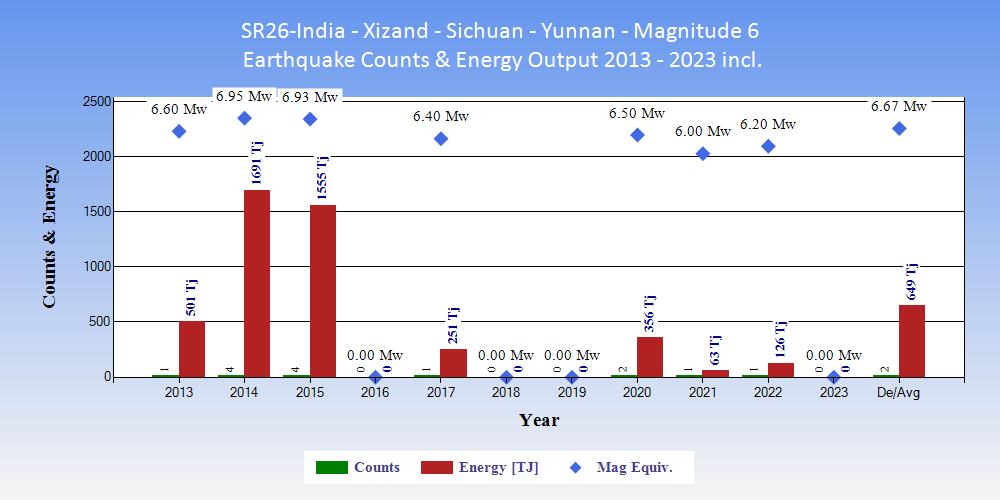
| Tables showing the ranking of 2023 within the 11 years 2013 to 2023 inclusive in terms of counts of earthquakes and energy output. |
|
|
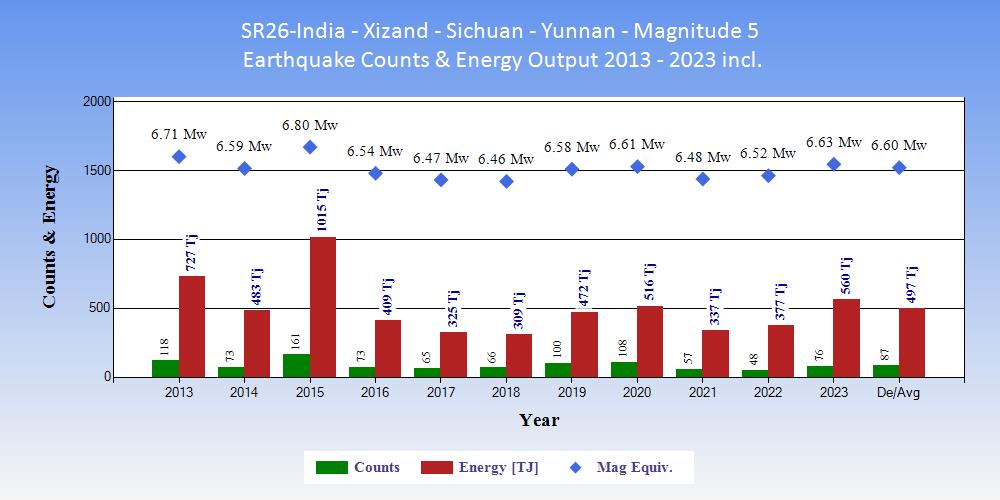
| Tables showing the ranking of 2023 within the 11 years 2013 to 2023 inclusive in terms of counts of earthquakes and energy output. |
|
|
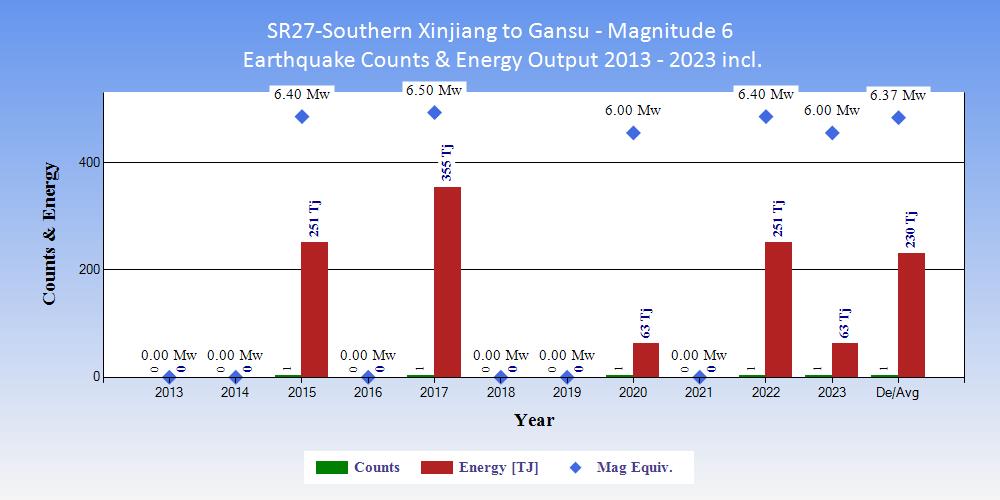
| Tables showing the ranking of 2023 within the 11 years 2013 to 2023 inclusive in terms of counts of earthquakes and energy output. |
|
|
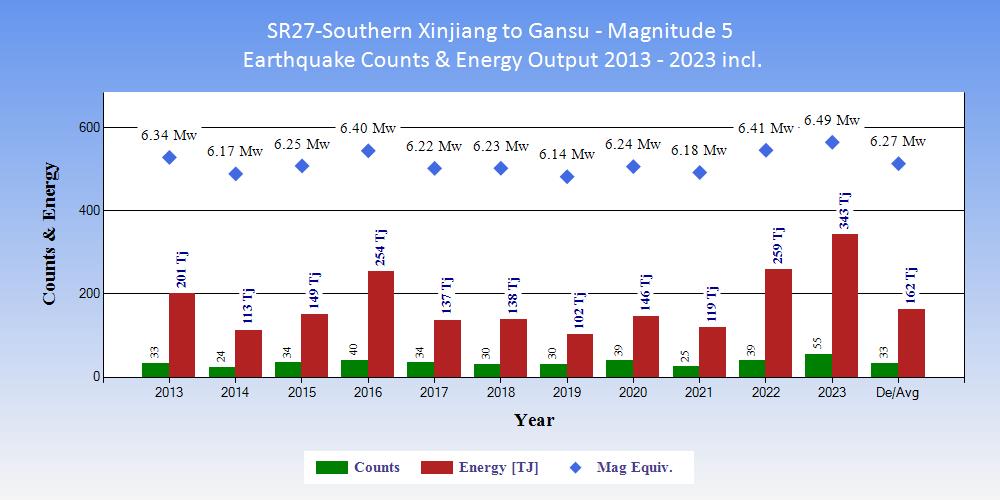
| Tables showing the ranking of 2023 within the 11 years 2013 to 2023 inclusive in terms of counts of earthquakes and energy output. |
|
|
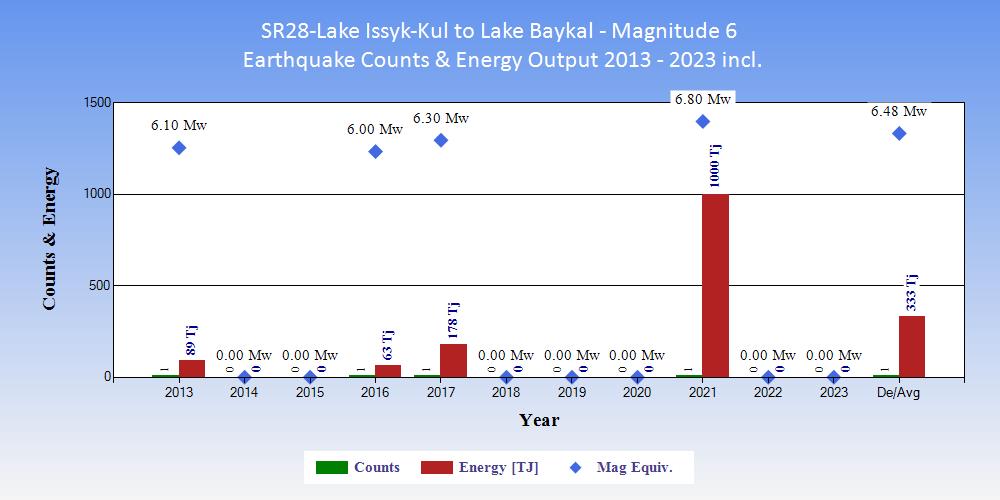
| Tables showing the ranking of 2023 within the 11 years 2013 to 2023 inclusive in terms of counts of earthquakes and energy output. |
|
|
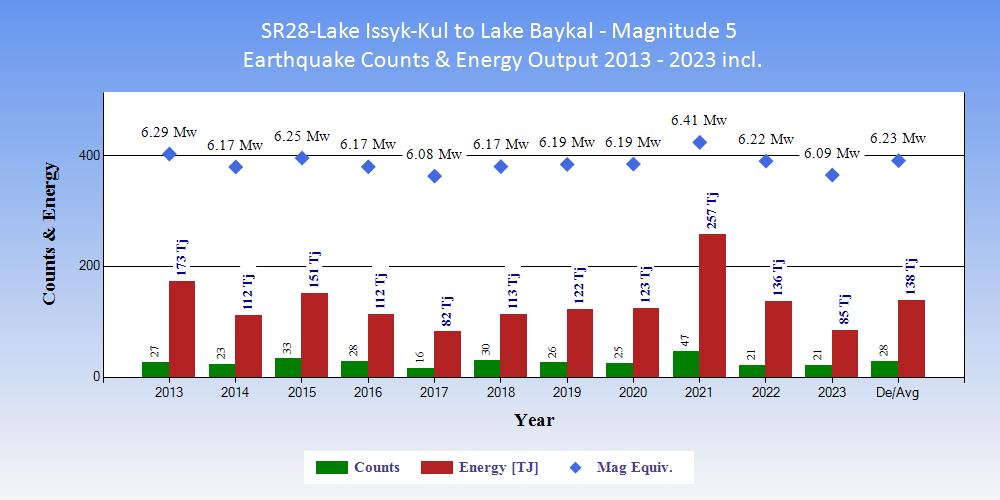
| Tables showing the ranking of 2023 within the 11 years 2013 to 2023 inclusive in terms of counts of earthquakes and energy output. |
|
|
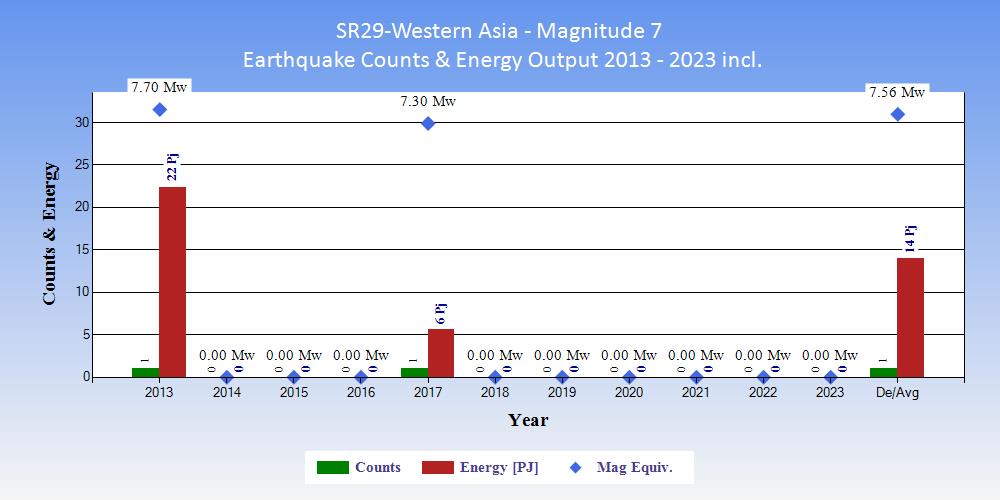
| Tables showing the ranking of 2023 within the 11 years 2013 to 2023 inclusive in terms of counts of earthquakes and energy output. |
|
|
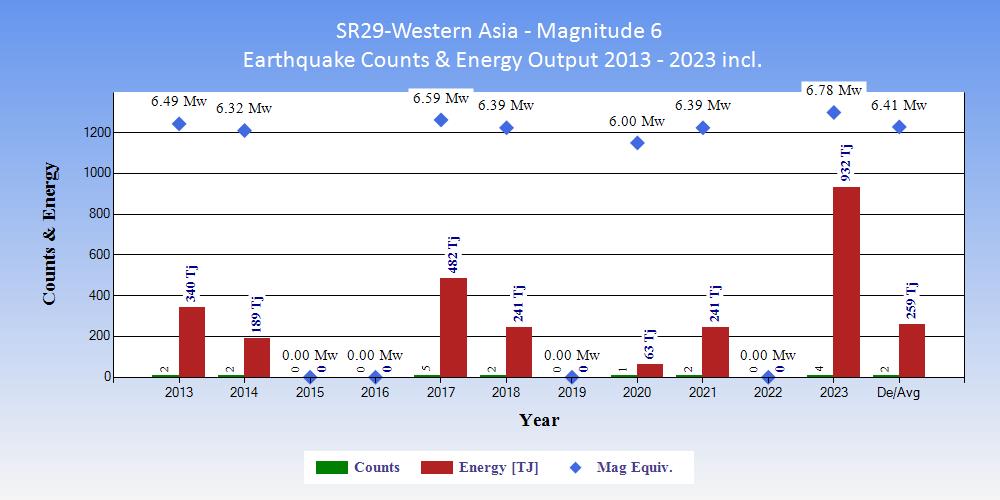
| Tables showing the ranking of 2023 within the 11 years 2013 to 2023 inclusive in terms of counts of earthquakes and energy output. |
|
|
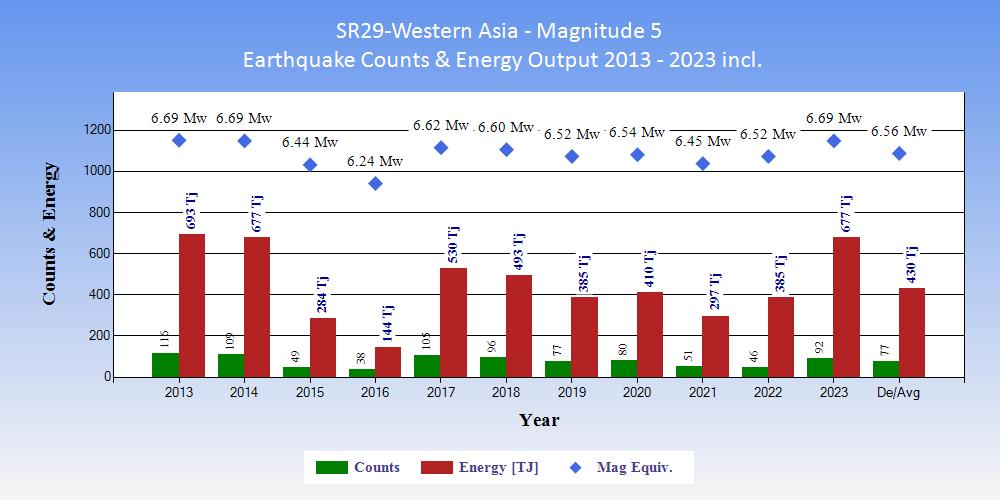
| Tables showing the ranking of 2023 within the 11 years 2013 to 2023 inclusive in terms of counts of earthquakes and energy output. |
|
|
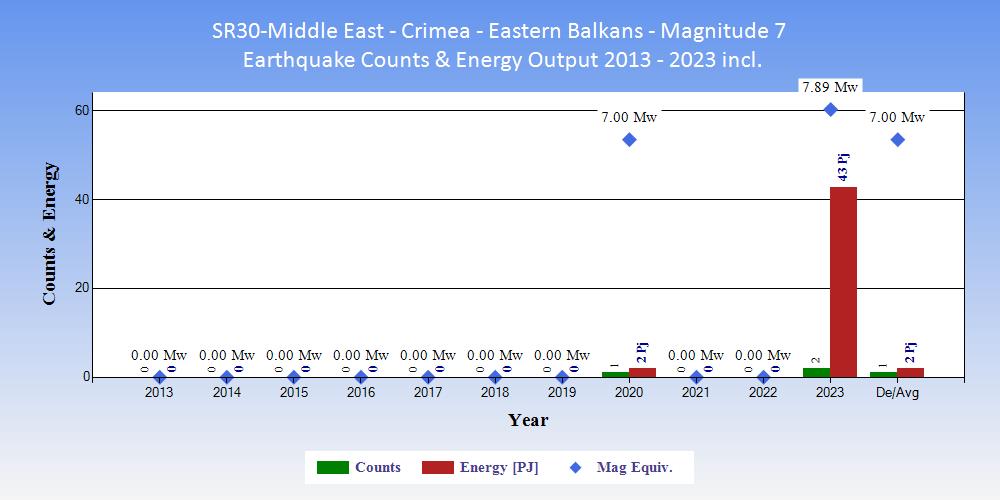
| Tables showing the ranking of 2023 within the 11 years 2013 to 2023 inclusive in terms of counts of earthquakes and energy output. |
|
|
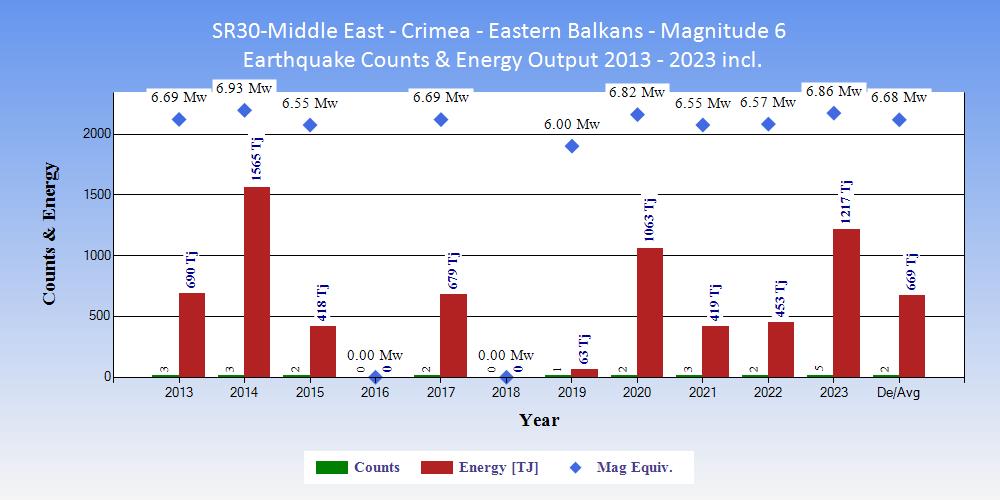
| Tables showing the ranking of 2023 within the 11 years 2013 to 2023 inclusive in terms of counts of earthquakes and energy output. |
|
|
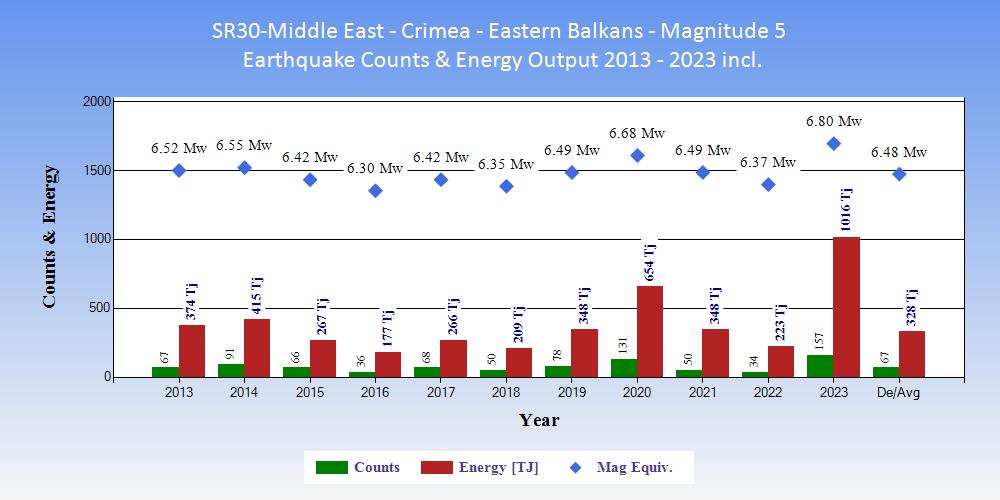
| Tables showing the ranking of 2023 within the 11 years 2013 to 2023 inclusive in terms of counts of earthquakes and energy output. |
|
|
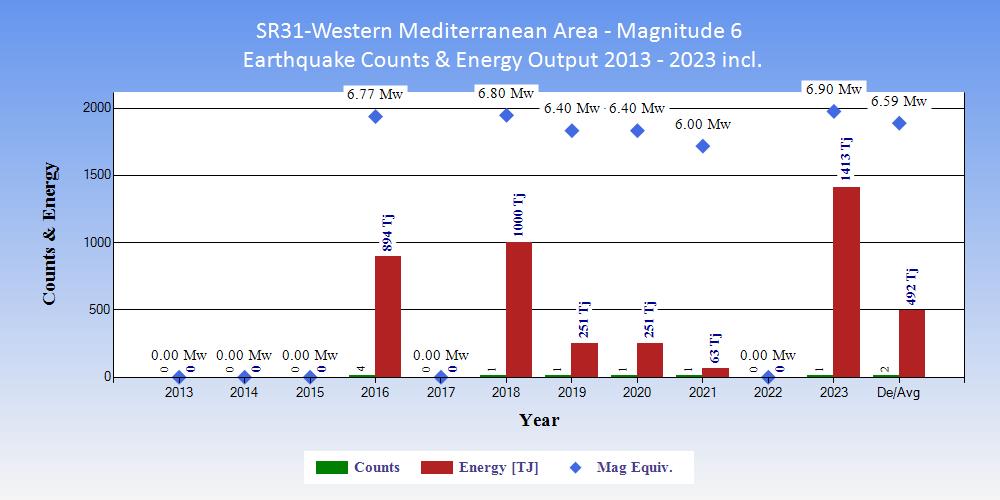
| Tables showing the ranking of 2023 within the 11 years 2013 to 2023 inclusive in terms of counts of earthquakes and energy output. |
|
|
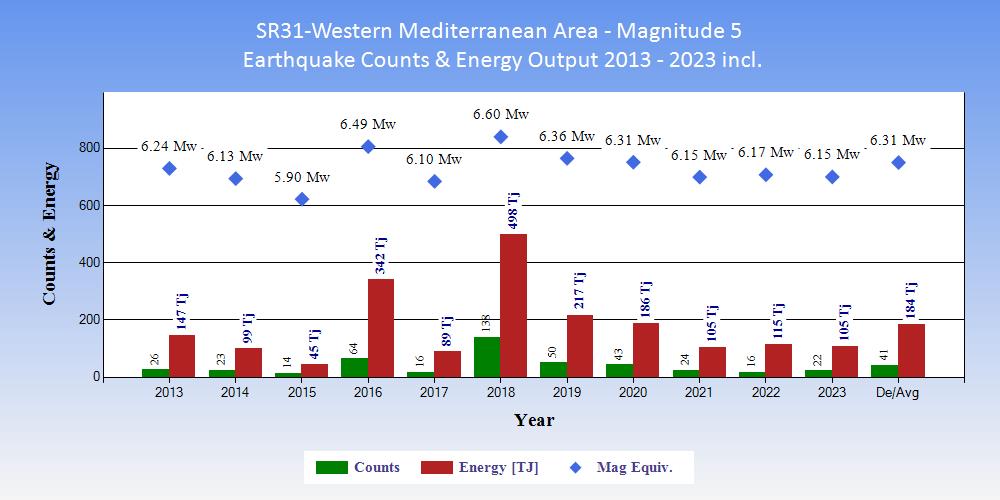
| Tables showing the ranking of 2023 within the 11 years 2013 to 2023 inclusive in terms of counts of earthquakes and energy output. |
|
|
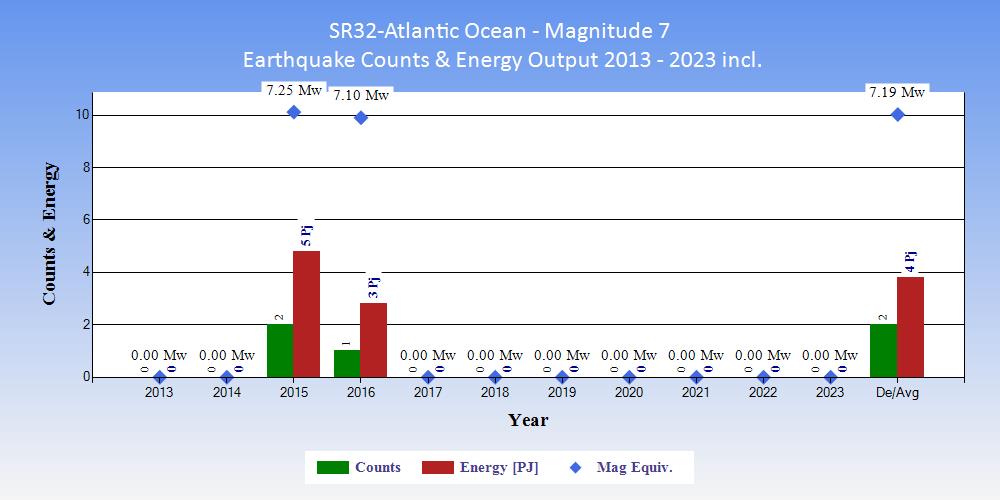
| Tables showing the ranking of 2023 within the 11 years 2013 to 2023 inclusive in terms of counts of earthquakes and energy output. |
|
|
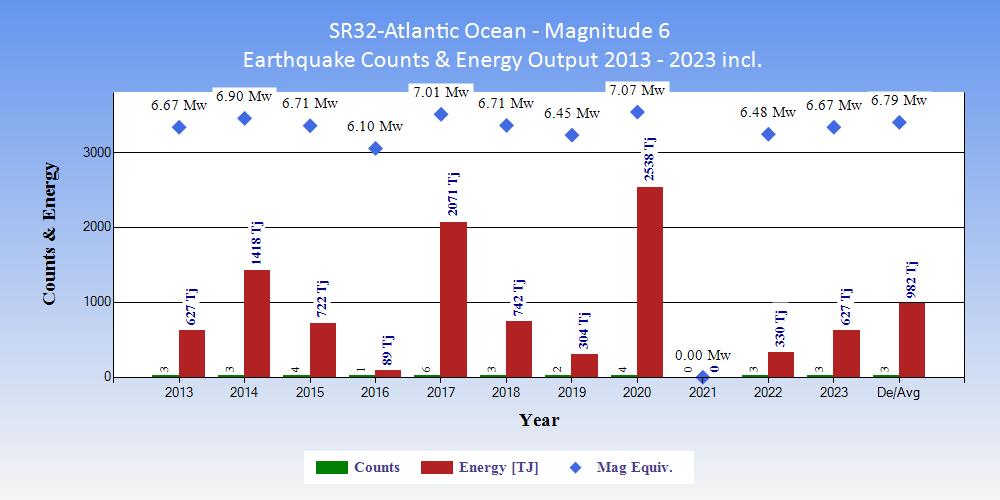
| Tables showing the ranking of 2023 within the 11 years 2013 to 2023 inclusive in terms of counts of earthquakes and energy output. |
|
|
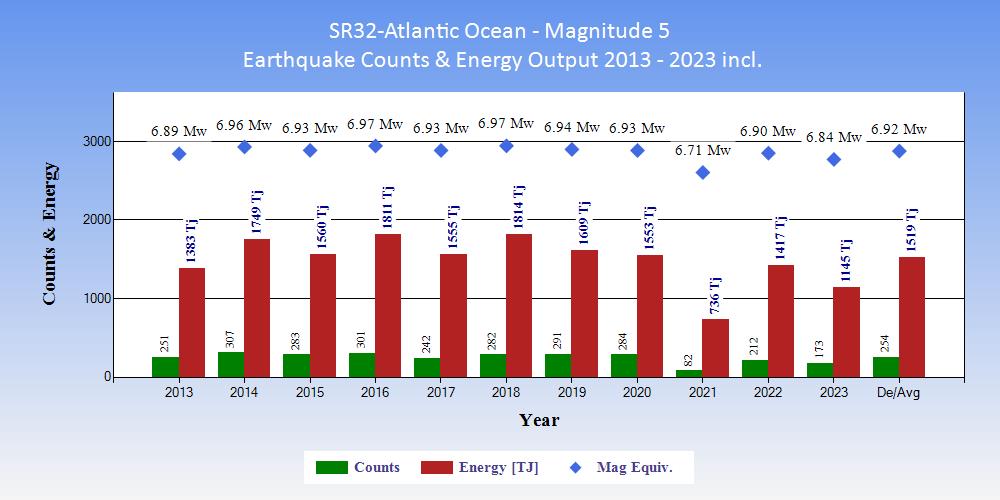
| Tables showing the ranking of 2023 within the 11 years 2013 to 2023 inclusive in terms of counts of earthquakes and energy output. |
|
|
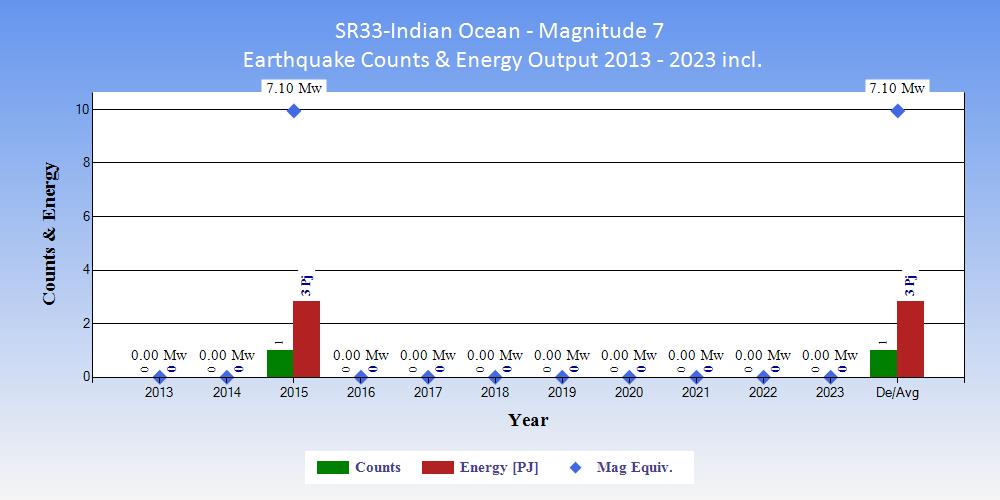
| Tables showing the ranking of 2023 within the 11 years 2013 to 2023 inclusive in terms of counts of earthquakes and energy output. |
|
|
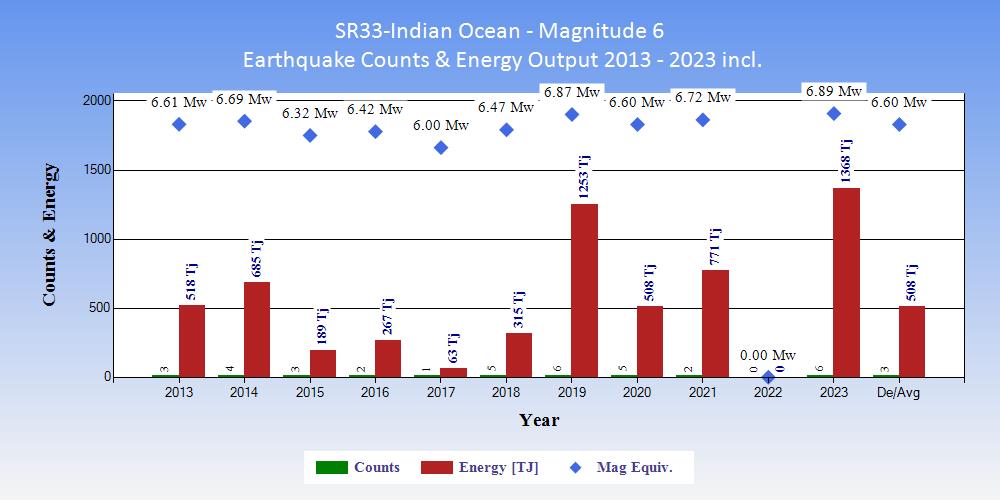
| Tables showing the ranking of 2023 within the 11 years 2013 to 2023 inclusive in terms of counts of earthquakes and energy output. |
|
|
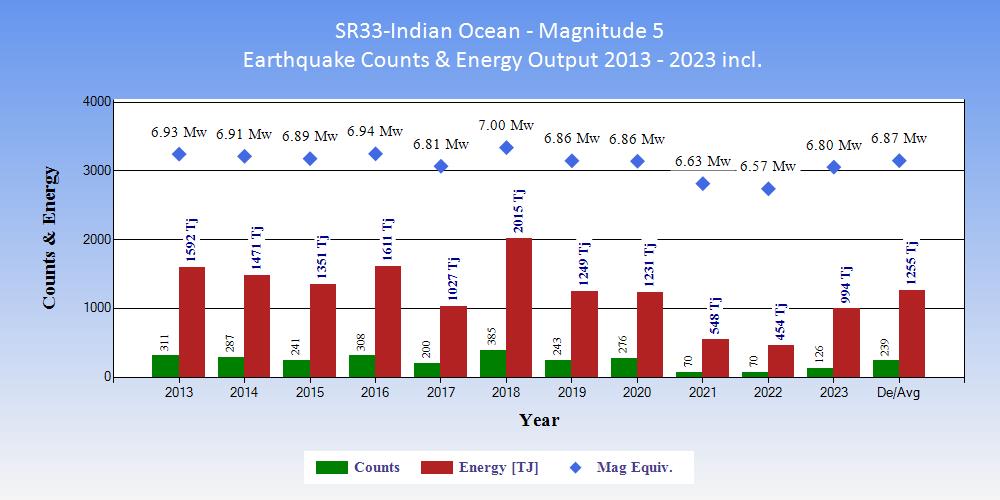
| Tables showing the ranking of 2023 within the 11 years 2013 to 2023 inclusive in terms of counts of earthquakes and energy output. |
|
|
| Tables showing the ranking of 2023 within the 11 years 2013 to 2023 inclusive in terms of counts of earthquakes and energy output. |
|
|
| Tables showing the ranking of 2023 within the 11 years 2013 to 2023 inclusive in terms of counts of earthquakes and energy output. |
|
|
| Tables showing the ranking of 2023 within the 11 years 2013 to 2023 inclusive in terms of counts of earthquakes and energy output. |
|
|
| Tables showing the ranking of 2023 within the 11 years 2013 to 2023 inclusive in terms of counts of earthquakes and energy output. |
|
|
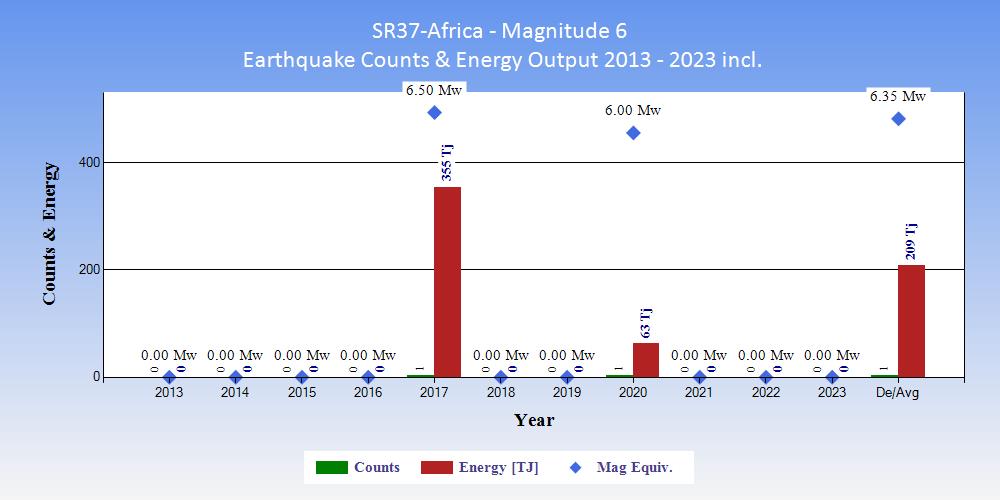
| Tables showing the ranking of 2023 within the 11 years 2013 to 2023 inclusive in terms of counts of earthquakes and energy output. |
|
|
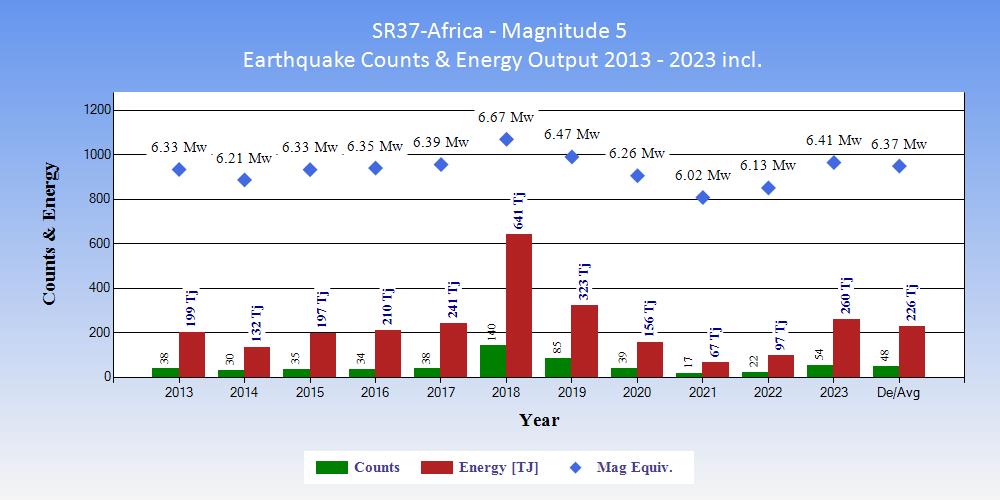
| Tables showing the ranking of 2023 within the 11 years 2013 to 2023 inclusive in terms of counts of earthquakes and energy output. |
|
|
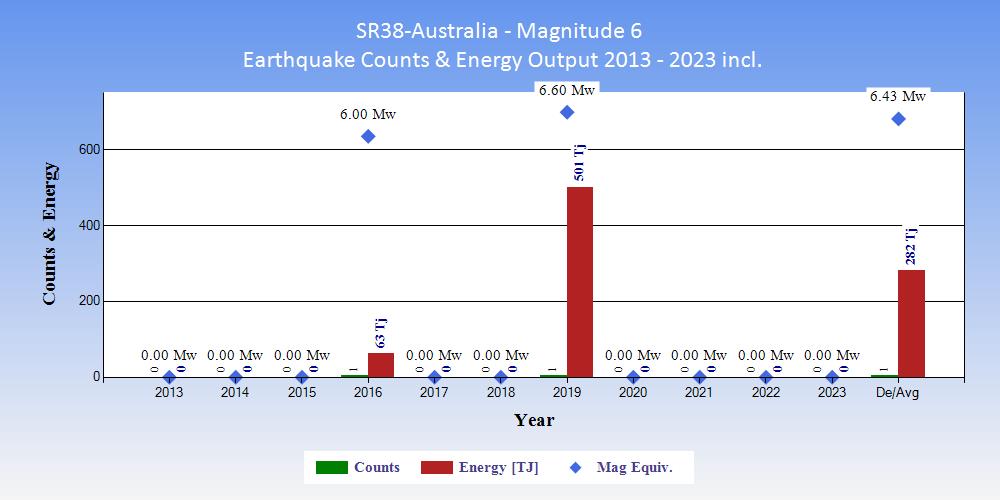
| Tables showing the ranking of 2023 within the 11 years 2013 to 2023 inclusive in terms of counts of earthquakes and energy output. |
|
|
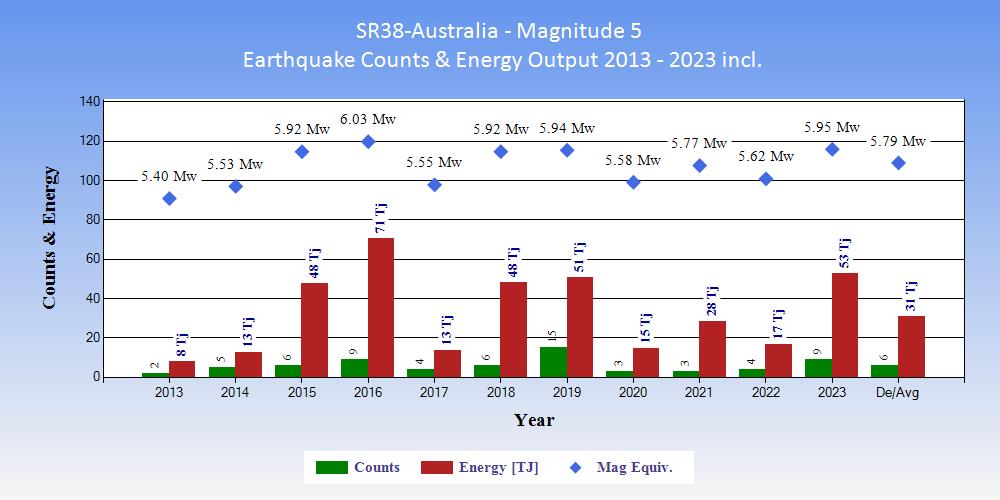
| Tables showing the ranking of 2023 within the 11 years 2013 to 2023 inclusive in terms of counts of earthquakes and energy output. |
|
|
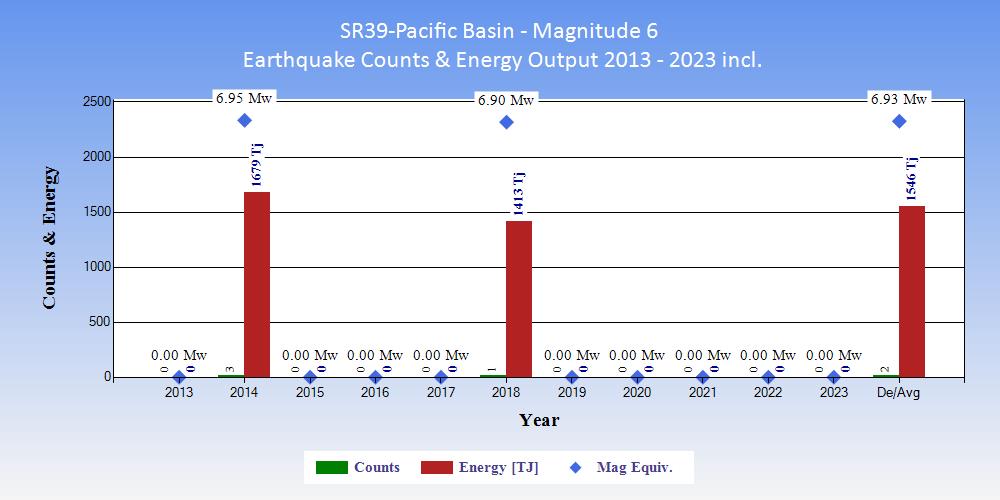
| Tables showing the ranking of 2023 within the 11 years 2013 to 2023 inclusive in terms of counts of earthquakes and energy output. |
|
|
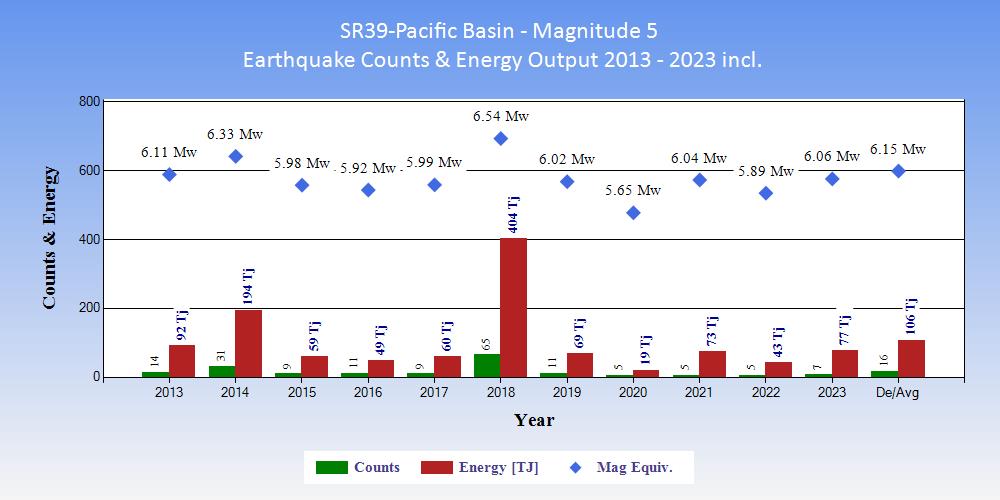
| Tables showing the ranking of 2023 within the 11 years 2013 to 2023 inclusive in terms of counts of earthquakes and energy output. |
|
|
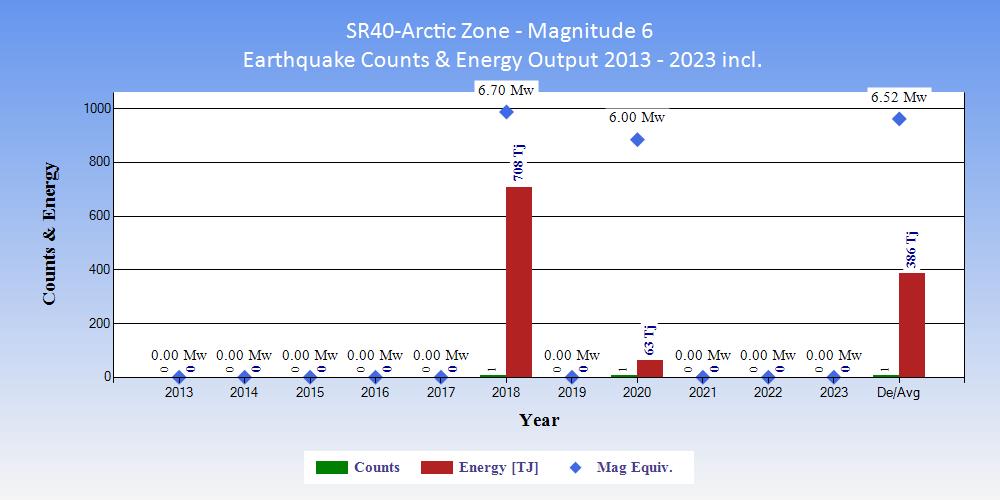
| Tables showing the ranking of 2023 within the 11 years 2013 to 2023 inclusive in terms of counts of earthquakes and energy output. |
|
|
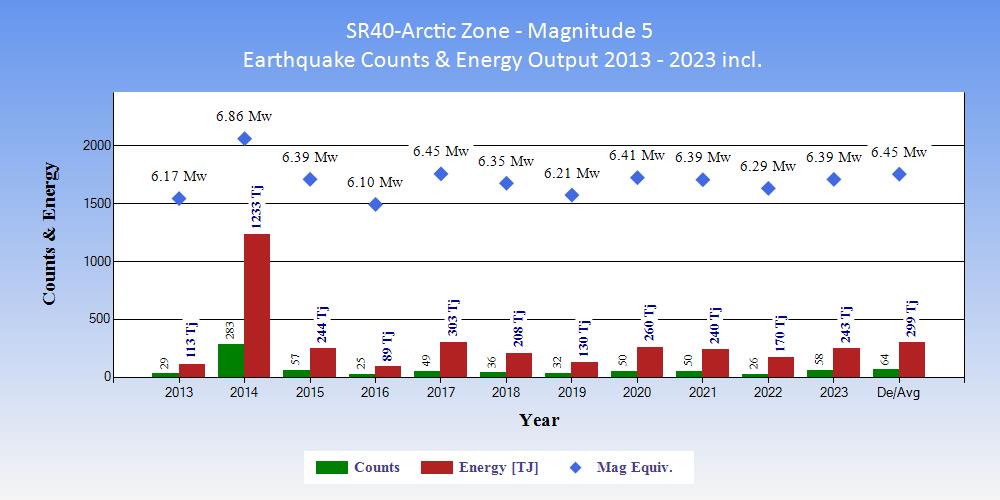
| Tables showing the ranking of 2023 within the 11 years 2013 to 2023 inclusive in terms of counts of earthquakes and energy output. |
|
|
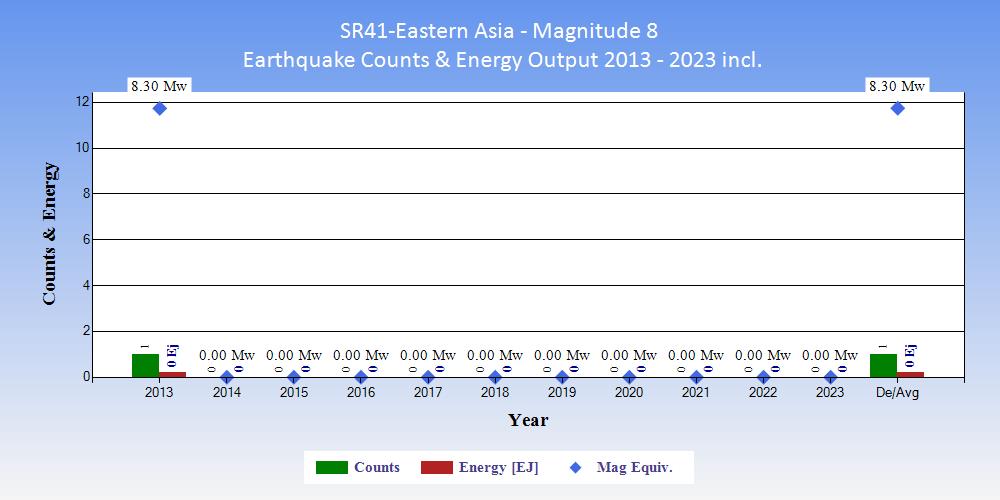
| Tables showing the ranking of 2023 within the 11 years 2013 to 2023 inclusive in terms of counts of earthquakes and energy output. |
|
|
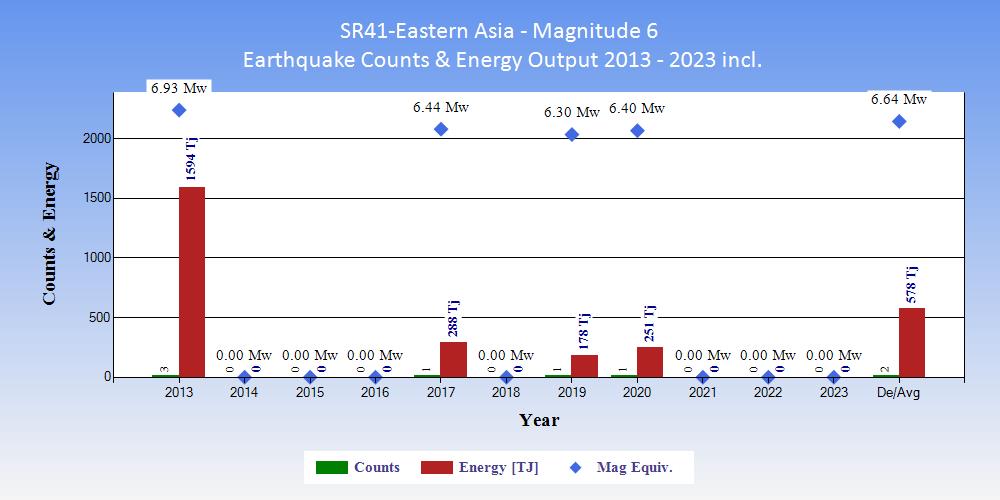
| Tables showing the ranking of 2023 within the 11 years 2013 to 2023 inclusive in terms of counts of earthquakes and energy output. |
|
|
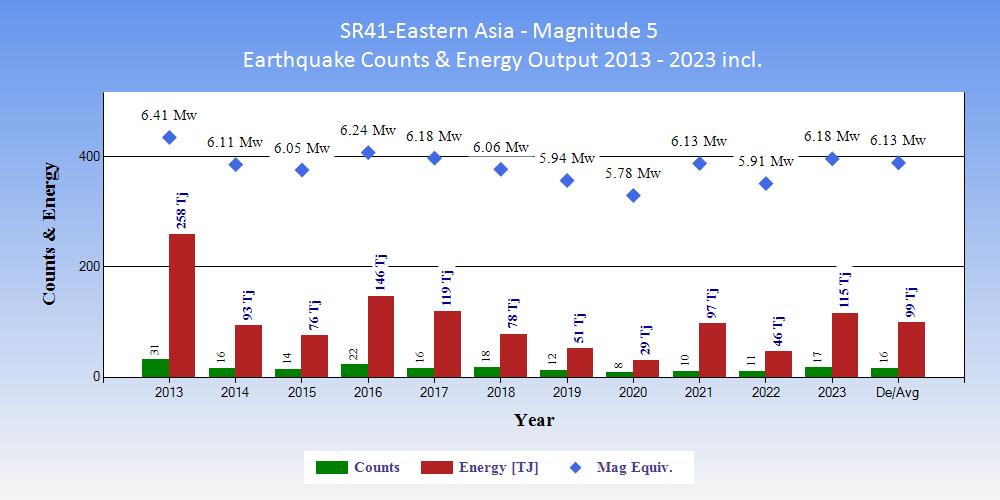
| Tables showing the ranking of 2023 within the 11 years 2013 to 2023 inclusive in terms of counts of earthquakes and energy output. |
|
|
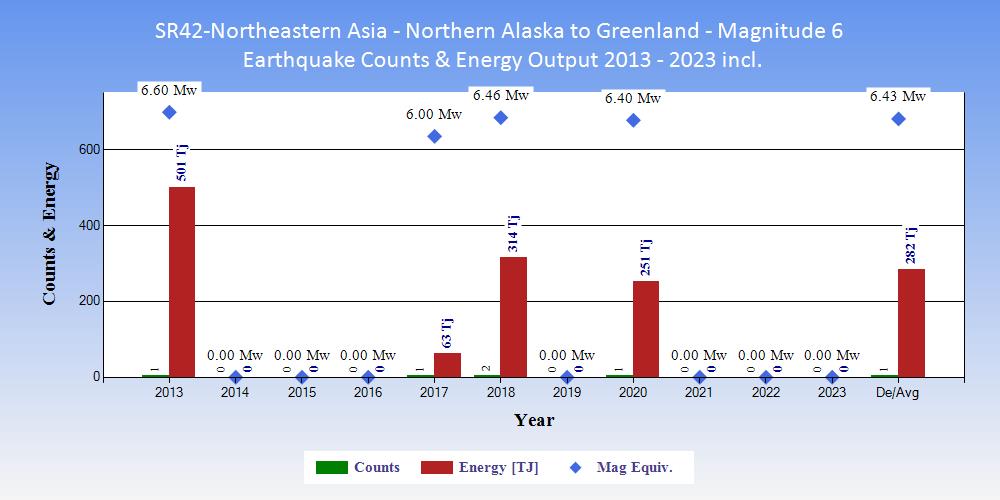
| Tables showing the ranking of 2023 within the 11 years 2013 to 2023 inclusive in terms of counts of earthquakes and energy output. |
|
|
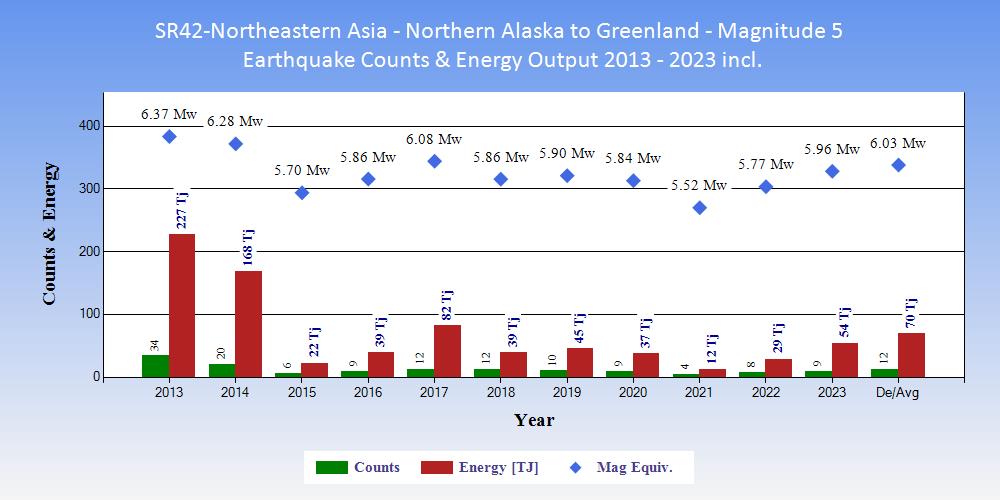
| Tables showing the ranking of 2023 within the 11 years 2013 to 2023 inclusive in terms of counts of earthquakes and energy output. |
|
|
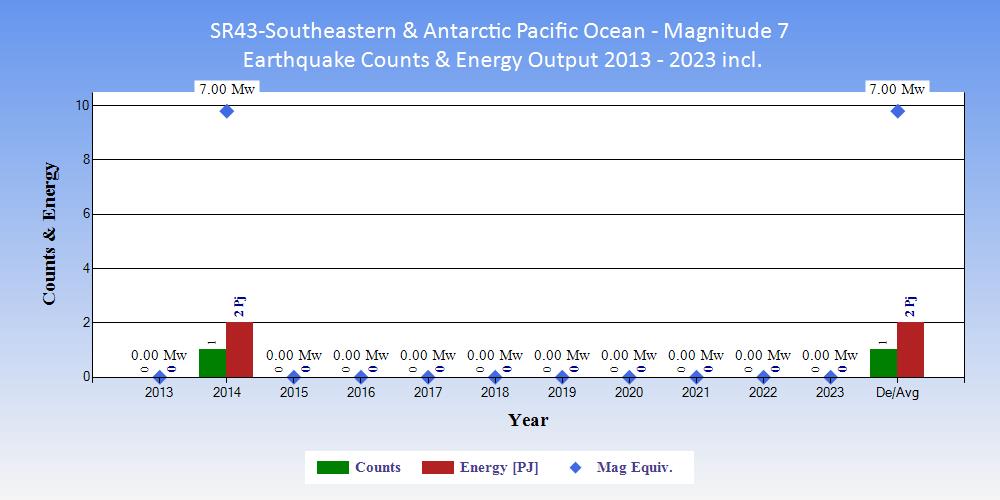
| Tables showing the ranking of 2023 within the 11 years 2013 to 2023 inclusive in terms of counts of earthquakes and energy output. |
|
|
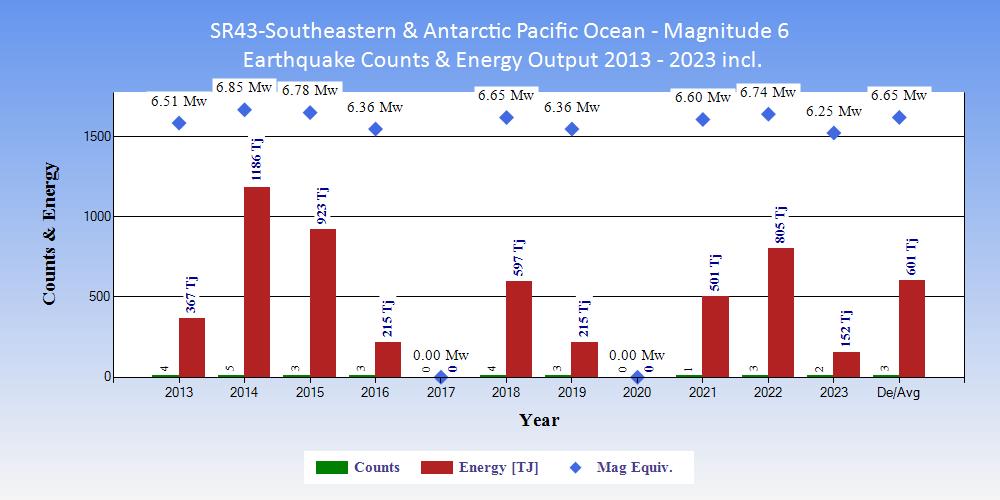
| Tables showing the ranking of 2023 within the 11 years 2013 to 2023 inclusive in terms of counts of earthquakes and energy output. |
|
|
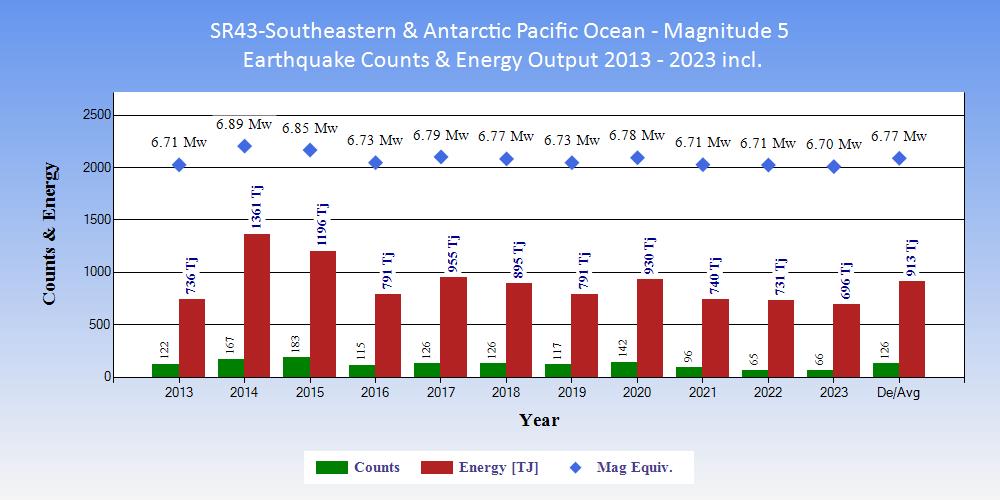
| Tables showing the ranking of 2023 within the 11 years 2013 to 2023 inclusive in terms of counts of earthquakes and energy output. |
|
|
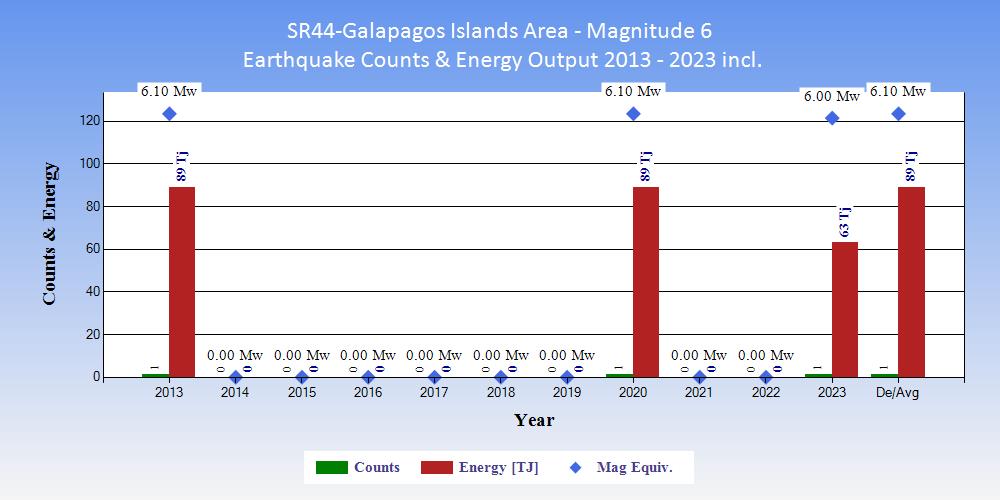
| Tables showing the ranking of 2023 within the 11 years 2013 to 2023 inclusive in terms of counts of earthquakes and energy output. |
|
|
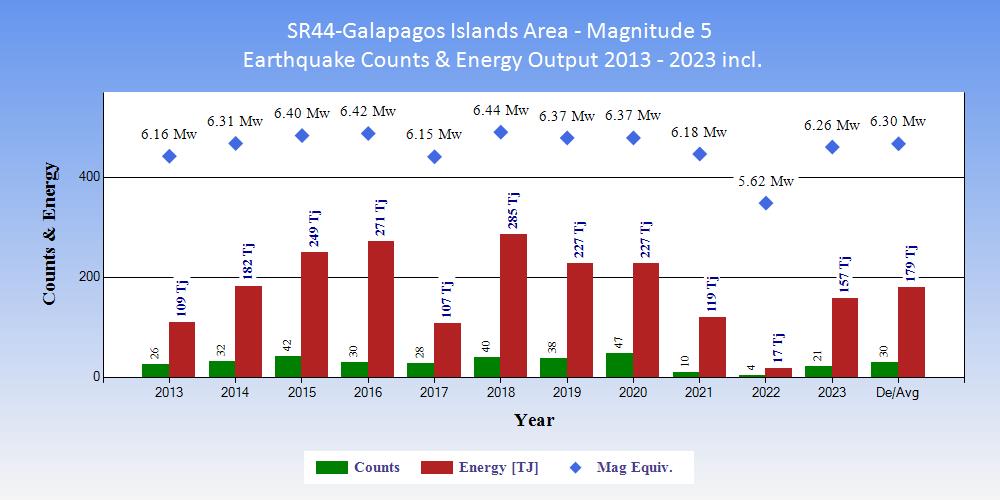
| Tables showing the ranking of 2023 within the 11 years 2013 to 2023 inclusive in terms of counts of earthquakes and energy output. |
|
|
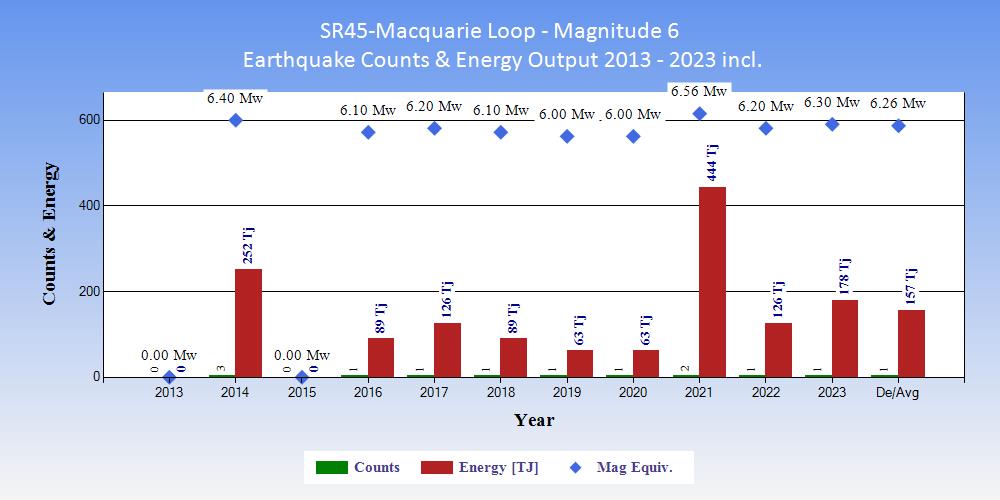
| Tables showing the ranking of 2023 within the 11 years 2013 to 2023 inclusive in terms of counts of earthquakes and energy output. |
|
|
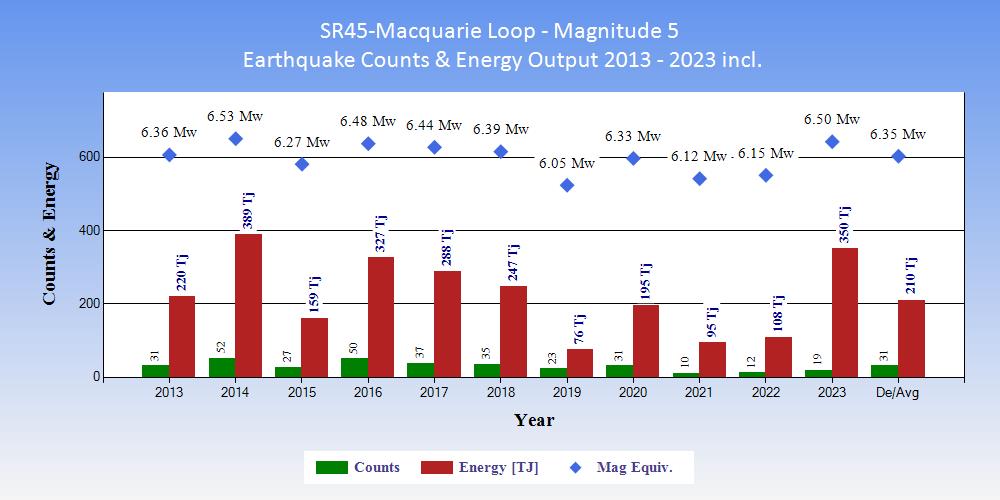
| Tables showing the ranking of 2023 within the 11 years 2013 to 2023 inclusive in terms of counts of earthquakes and energy output. |
|
|
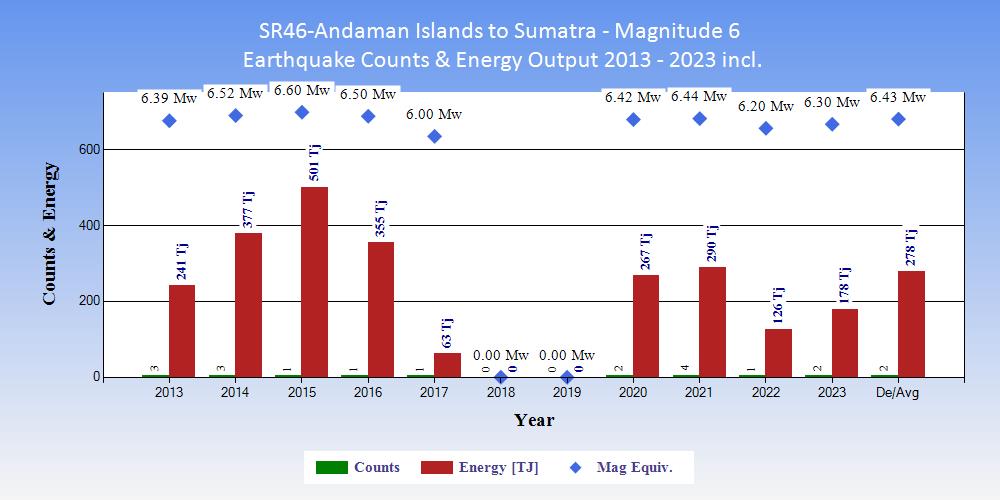
| Tables showing the ranking of 2023 within the 11 years 2013 to 2023 inclusive in terms of counts of earthquakes and energy output. |
|
|
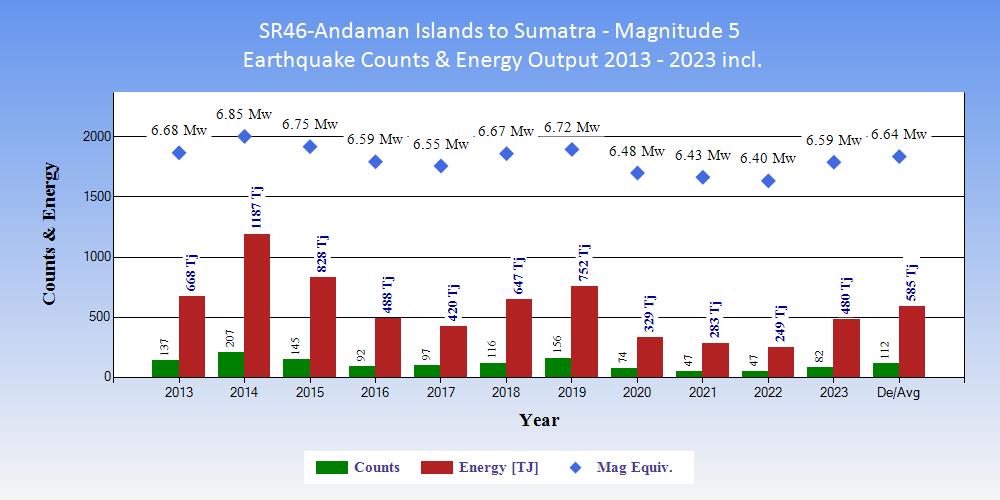
| Tables showing the ranking of 2023 within the 11 years 2013 to 2023 inclusive in terms of counts of earthquakes and energy output. |
|
|
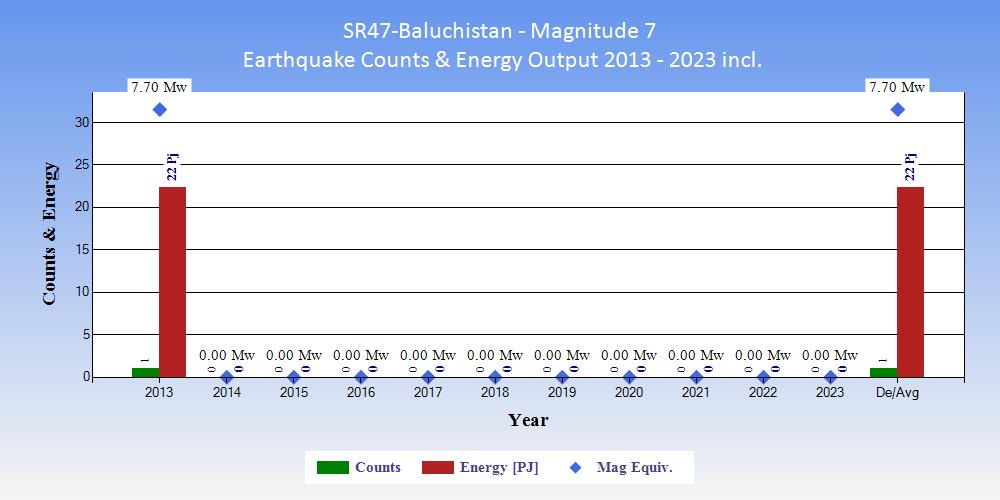
| Tables showing the ranking of 2023 within the 11 years 2013 to 2023 inclusive in terms of counts of earthquakes and energy output. |
|
|
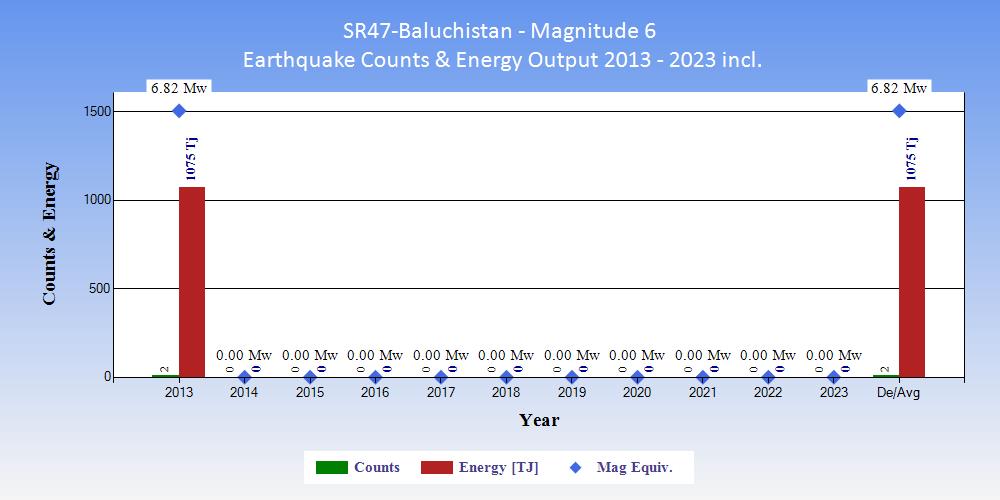
| Tables showing the ranking of 2023 within the 11 years 2013 to 2023 inclusive in terms of counts of earthquakes and energy output. |
|
|
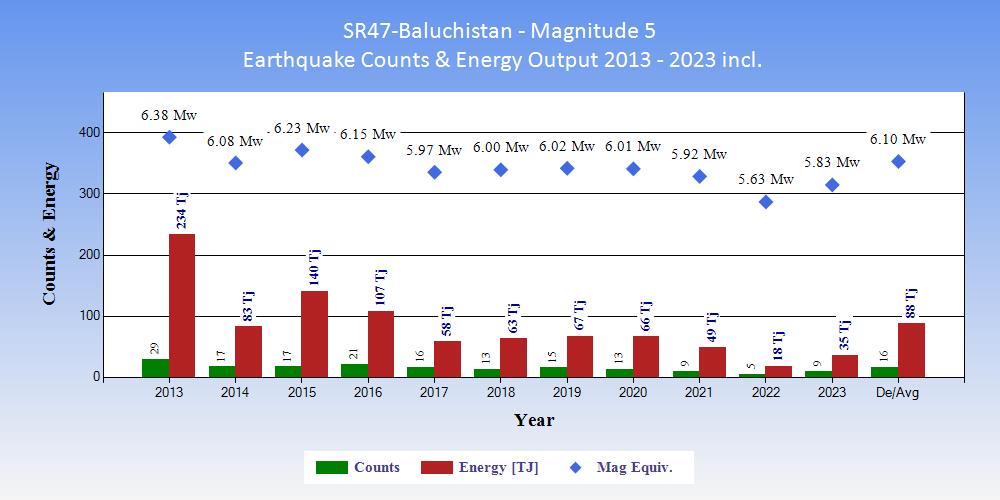
| Tables showing the ranking of 2023 within the 11 years 2013 to 2023 inclusive in terms of counts of earthquakes and energy output. |
|
|
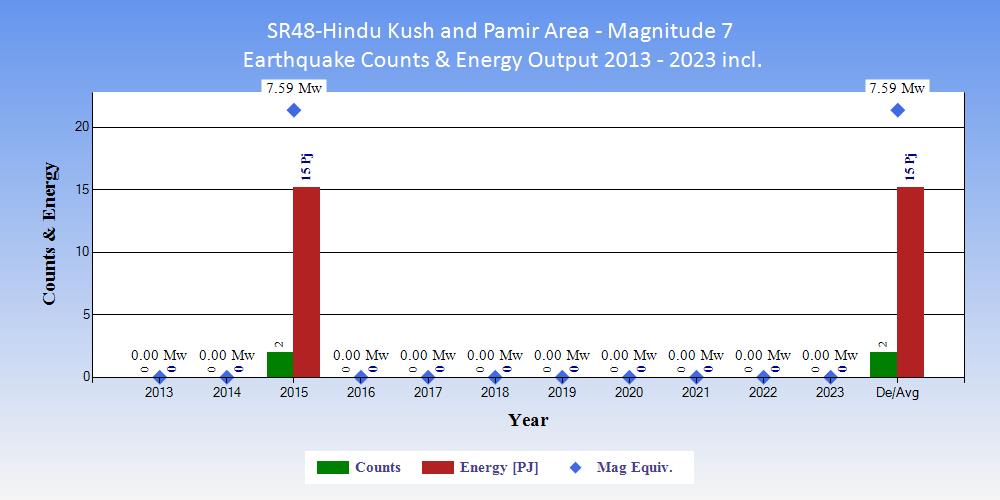
| Tables showing the ranking of 2023 within the 11 years 2013 to 2023 inclusive in terms of counts of earthquakes and energy output. |
|
|
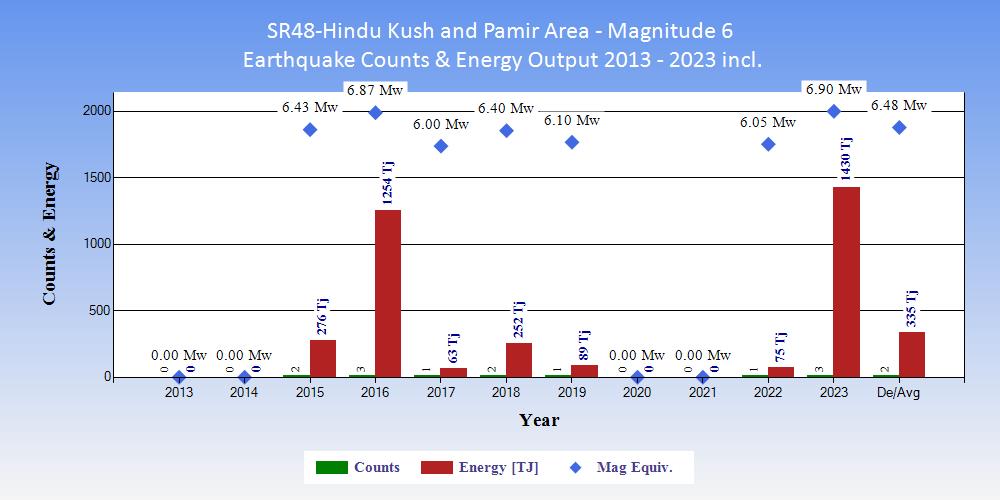
| Tables showing the ranking of 2023 within the 11 years 2013 to 2023 inclusive in terms of counts of earthquakes and energy output. |
|
|
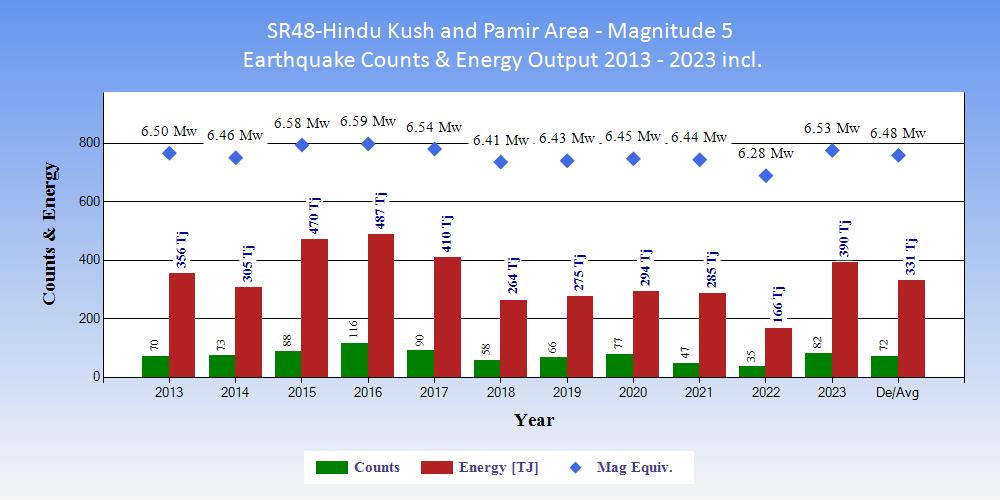
| Tables showing the ranking of 2023 within the 11 years 2013 to 2023 inclusive in terms of counts of earthquakes and energy output. |
|
|
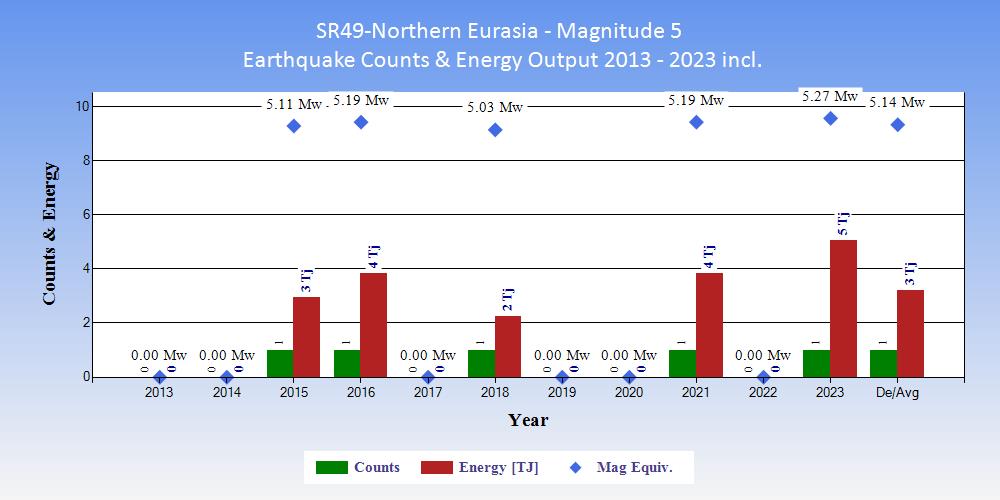
| Tables showing the ranking of 2023 within the 11 years 2013 to 2023 inclusive in terms of counts of earthquakes and energy output. |
|
|
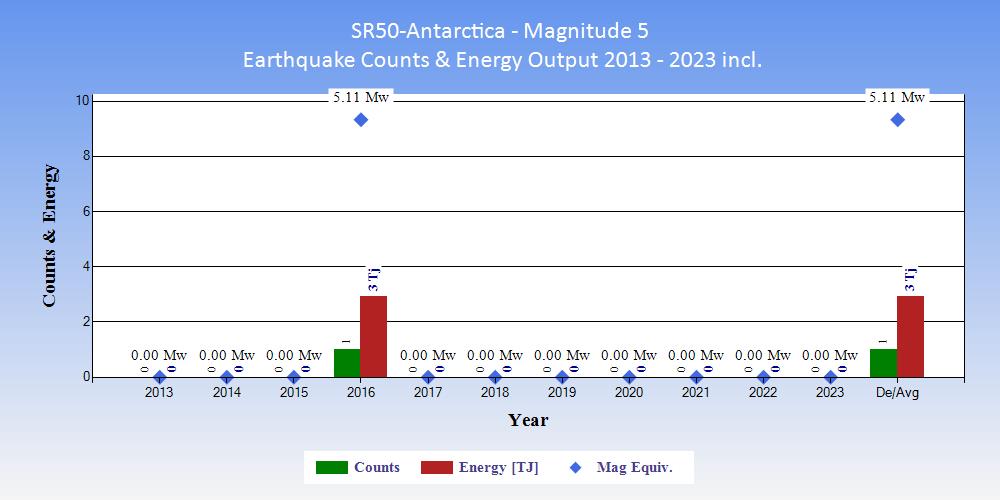
| Tables showing the ranking of 2023 within the 11 years 2013 to 2023 inclusive in terms of counts of earthquakes and energy output. |
|
|