Last Updated on July 22, 2025 by PuterMan
Summary: 2019 was a relatively ‘quiet’ year in earthquake terms with no events of great significance in terms of seismic energy indeed it ranks below any other year in the preceding decade in energy output. The only ‘great’ earthquake was a magnitude 8.0 in Northern Peru on May 26th. There were 9 ‘major’ earthquakes, considerably fewer than in most years.
Acknowledgement: I am grateful to the USGS/ANSS and EMSC for supplying data for public consumption. All data used in this report has been extracted from USGS/ANSS and EMSC sources available on the internet. In general the ANSS Comcat data is used for data up to and including 2012 and EMSC data from the seismic portal FDSN WS-EVENT raw demo access is used for the remaining years. There is nothing significant about these cut-off dates other than that the EU data that I have collected starts around 2010.
Earthquake Analysis 2019
Since the 2011 Tokohu earthquake in Japan there seems to have been a period of decreasing output.
Looking at the global comparison to the previous decade by each magnitude band we see
|
2019 produced lower counts and energy of Magnitude 5 earthquakes than the decade average. The year ranked 6th in the 11 years 2009 to 2019 but only 9th in energy output of Magnitude 5 earthquakes. |
|
|
| The count of Mag 6 earthquakes globally at 143 was almost equal to the decade average of 141 placing it 5th in the counts ranking for 2009 to 2019 inclusive.
The energy output, which was the equivalent of a single magnitude 7.8 earthquake placed it lower in the rankings at 8th position out of 11. The count of Magnitude 6 earthquakes in the 2019 listing differs slightly. The list shows 133 for USGS and 143 for EMSC. Since this analysis is based on a mix the count is slightly different. The difference is not statistically significant in this case. Currently (Dec 2020) COMCAT lists 135 Mw or Mww and 2 No 5.8 mb which equates to 6.08 Mw. |
|
|
| With 9 magnitude 7 earthquakes 2019 was 10th in the listing for counts and energy equivalent with only 2017 below it.
These earthquake occurred in the ‘normal’ area with the exception of a mag 6.4 and mag 7.1 in Central California. |
|
|
| Just a single magnitude 8 great earthquake in Paddington Bear country, well Northern Peru which may or may not be part of darkest Peru. 🙂 |
|
|
| Fortunately no magnitude 9 earthquakes to report for 2019 or indeed any of the years since the Tokohu earthquake in Japan in 2011. |
|
|
You can view the same format for each seismic region as defined by Flinn-Enghdal in the concertina tabs below. Click a plus sign to see the information for that area.
Seismic Region 1 - Alaska - Aleutan arc
Seismic Region 2 - Southeastern Alaska to Washington
Seismic Region 3 - Oregon - California and Nevada
Seismic Region 4 - Baja California and Gulf of California
Seismic Region 5 - Mexico - Guatemala Area
Seismic Region 6 - Central America
Seismic Region 7 - Caribbean loop
Seismic Region 8 - Andean South America
Seismic Region 9 - Extreme South America
Seismic Region 10 - Southern Antilles
Seismic Region 11 - New Zealand region
Seismic Region 12 - Tonga - Samoa Basin area
Seismic Region 13 - Fiji Islands area
Seismic Region 14 - Vanuatu Islands
Seismic Region 15 - Bismarck and Solomon Islands
Seismic Region 16 - New Guinea
Seismic Region 17 - Caroline Islands area
Seismic Region 18 - Guam to Japan
Seismic Region 19 - Japan - Kuril Islands - Kamchatka Peninsula
Seismic Region 20 - Southwestern Japan and Ryukyu Islands
Seismic Region 21 - Taiwan area
Seismic Region 22 - Philippine Islands
Seismic Region 23 - Borneo - Sulawesi
Seismic Region 24 - Sunda arc
Seismic Region 25 - Myanmar and Southeast Asia
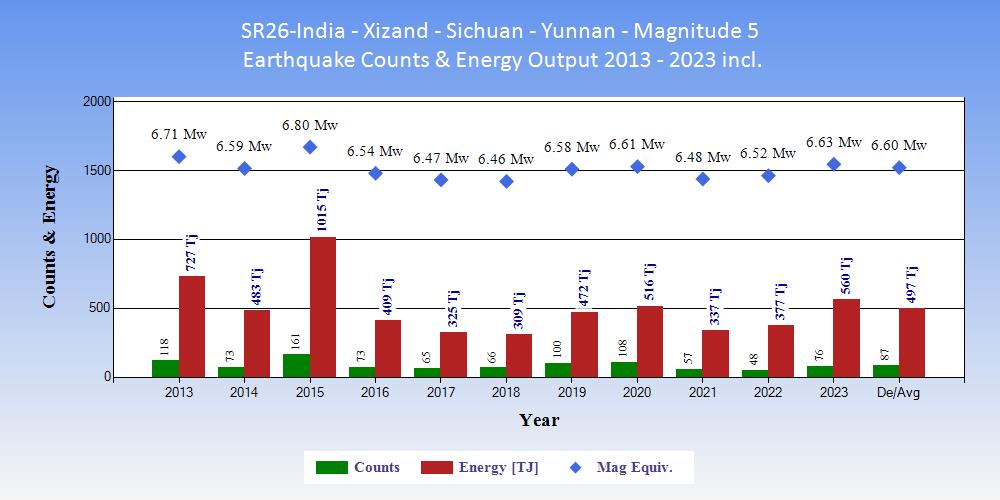
Seismic Region 26 - India - Xizang - Sichuan - Yunnan
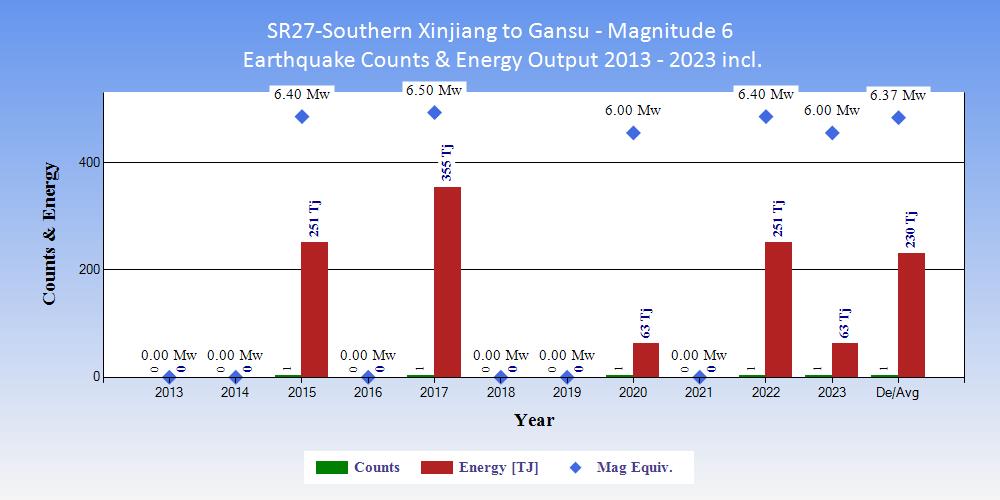
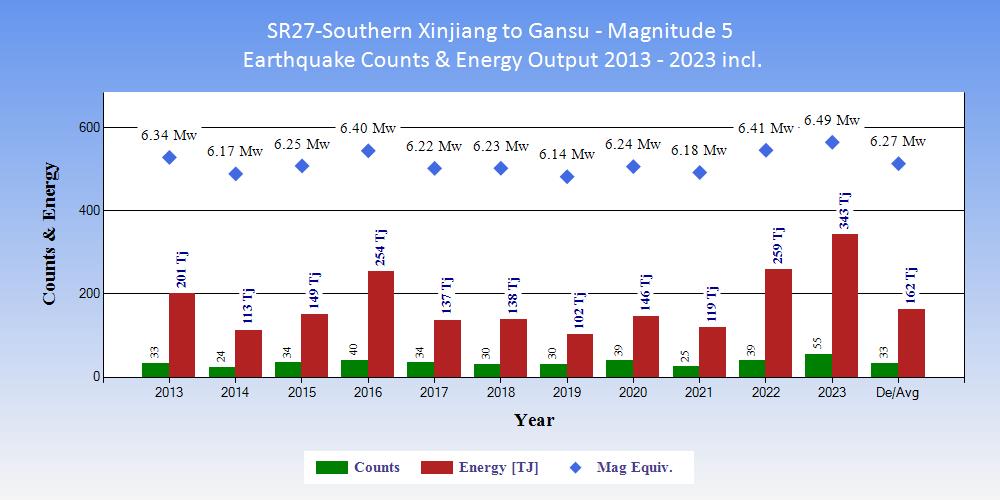
Seismic Region 27 - Southern Xinjiang to Gansu
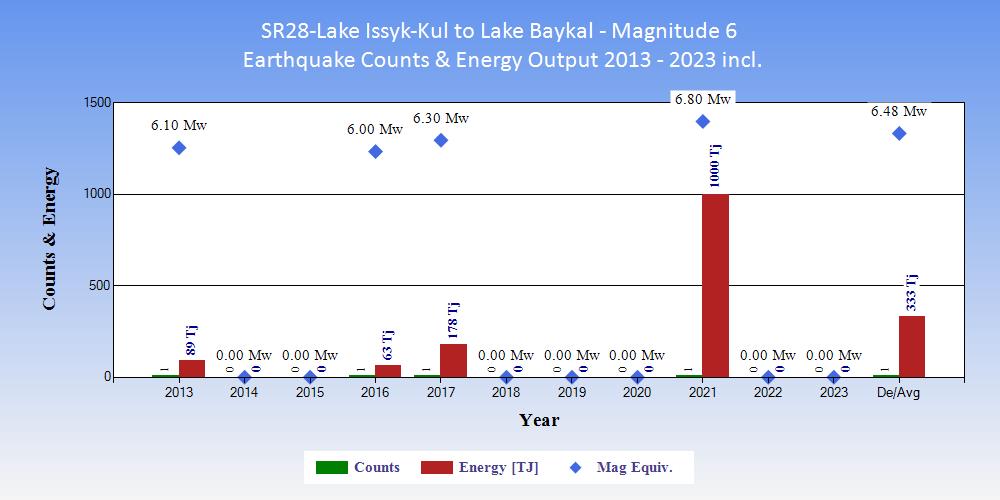
Seismic Region 28 - Lake Issyk-Kul to Lake Baykal
Seismic Region 29 - Western Asia
Seismic Region 30 - Middle East - Crimea - Eastern Balkans
Seismic Region 31 - Western Mediterranean area
Seismic Region 32 - Atlantic Ocean
Seismic Region 33 - Indian Ocean
Seismic Region 34 - Eastern North America
Seismic Region 35 - Eastern South America
Seismic Region 36 - Northwestern Europe
Seismic Region 37 - Africa
Seismic Region 38 - Australia
Seismic Region 39 - Pacific Basin
Seismic Region 40 - Arctic zone
Seismic Region 41 - Eastern Asia
Seismic Region 42 - Northeastern Asia, Northern Alaska to Greenland
Seismic Region 43 - Southeastern and Antarctic Pacific Ocean
Seismic Region 44 - Galápagos Islands area
Seismic Region 45 - Macquarie loop
Seismic Region 46 - Andaman Islands to Sumatra
Seismic Region 47 - Baluchistan
Seismic Region 48 - Hindu Kush and Pamir area
Seismic Region 49 - Northern Eurasia
Seismic Region 50 - Antarctica
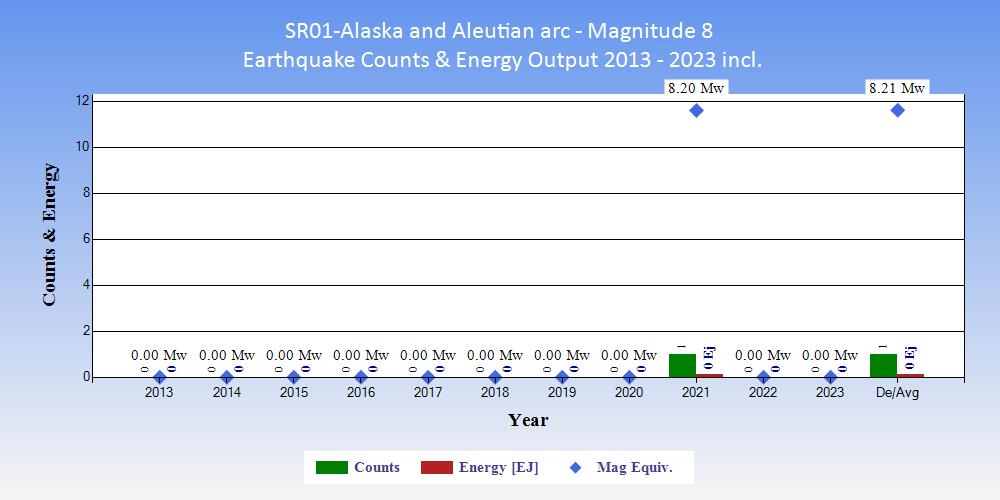
| Tables showing the ranking of 2023 within the 11 years 2013 to 2023 inclusive in terms of counts of earthquakes and energy output. |
|
|
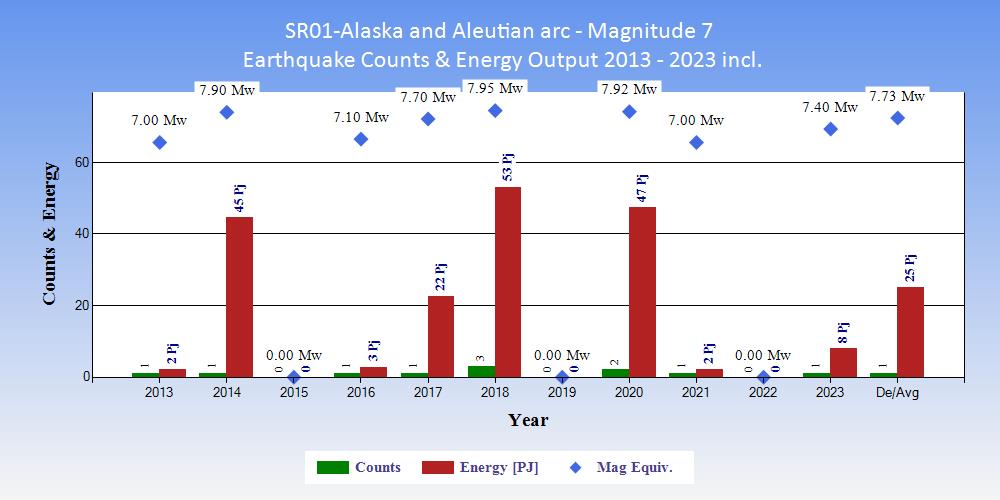
| Tables showing the ranking of 2023 within the 11 years 2013 to 2023 inclusive in terms of counts of earthquakes and energy output. |
|
|
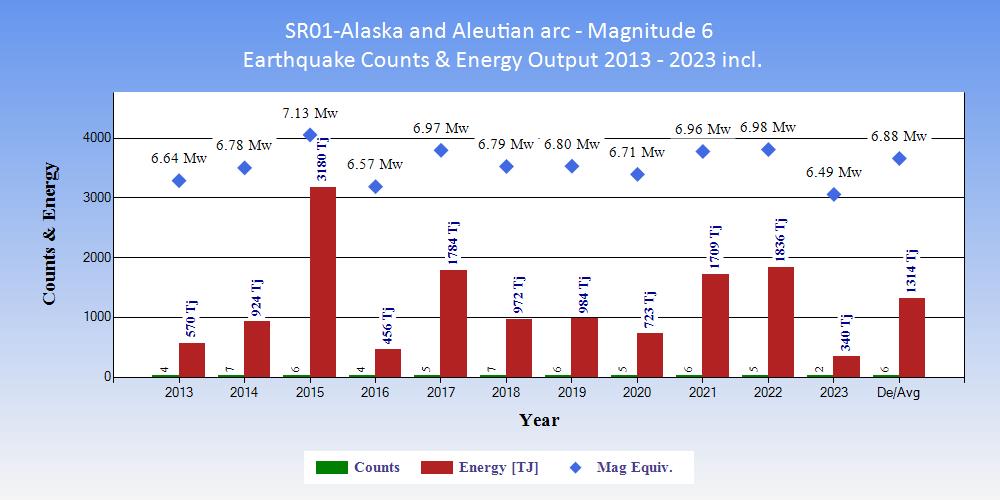
| Tables showing the ranking of 2023 within the 11 years 2013 to 2023 inclusive in terms of counts of earthquakes and energy output. |
|
|
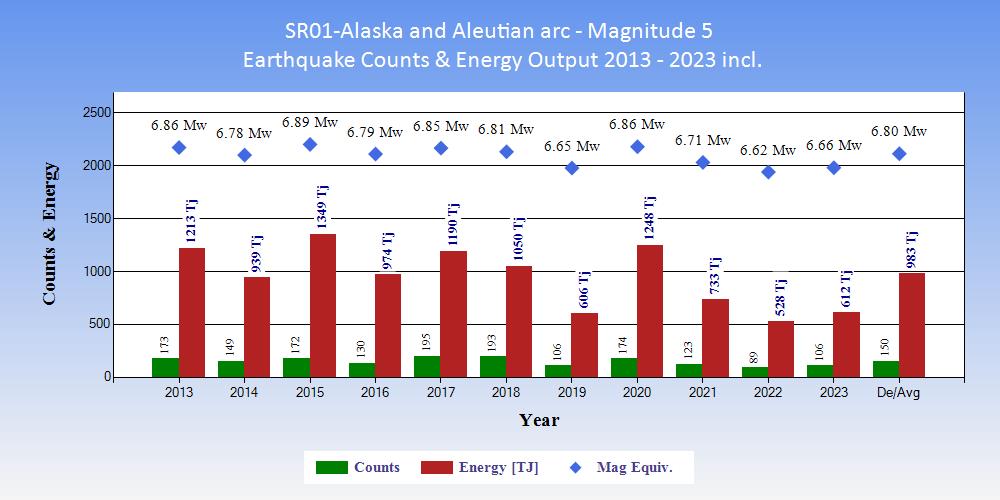
| Tables showing the ranking of 2023 within the 11 years 2013 to 2023 inclusive in terms of counts of earthquakes and energy output. |
|
|
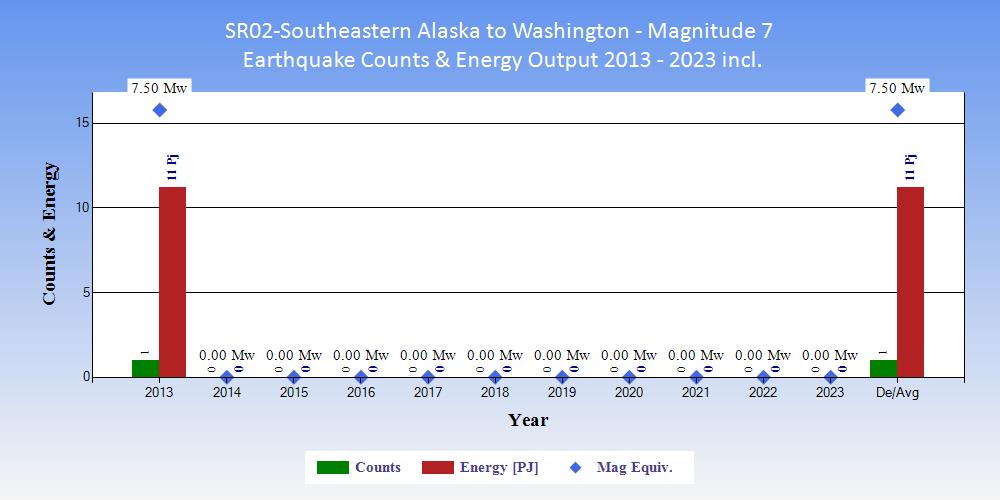
| Tables showing the ranking of 2023 within the 11 years 2013 to 2023 inclusive in terms of counts of earthquakes and energy output. |
|
|
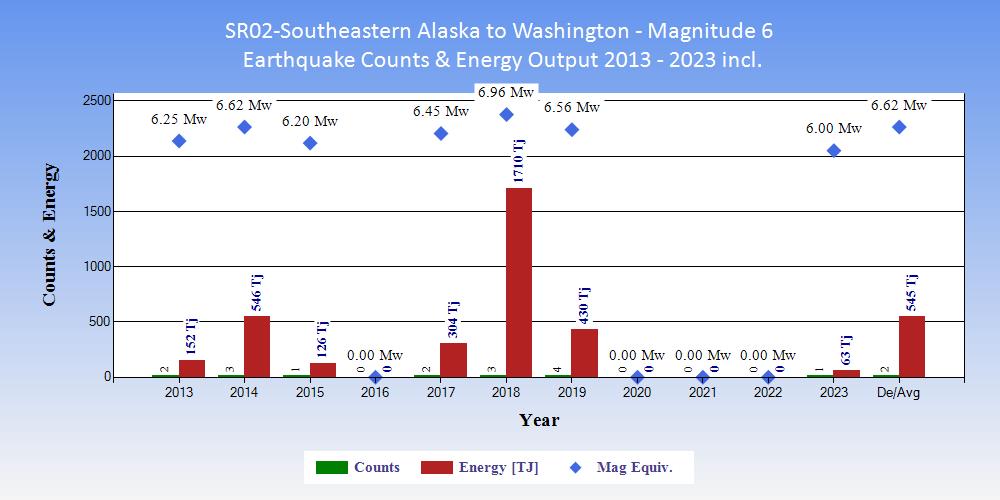
| Tables showing the ranking of 2023 within the 11 years 2013 to 2023 inclusive in terms of counts of earthquakes and energy output. |
|
|
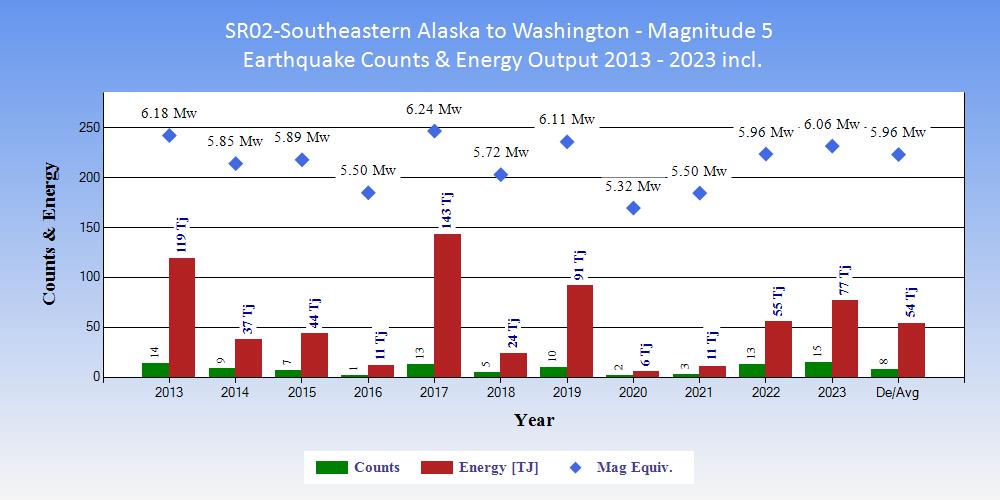
| Tables showing the ranking of 2023 within the 11 years 2013 to 2023 inclusive in terms of counts of earthquakes and energy output. |
|
|
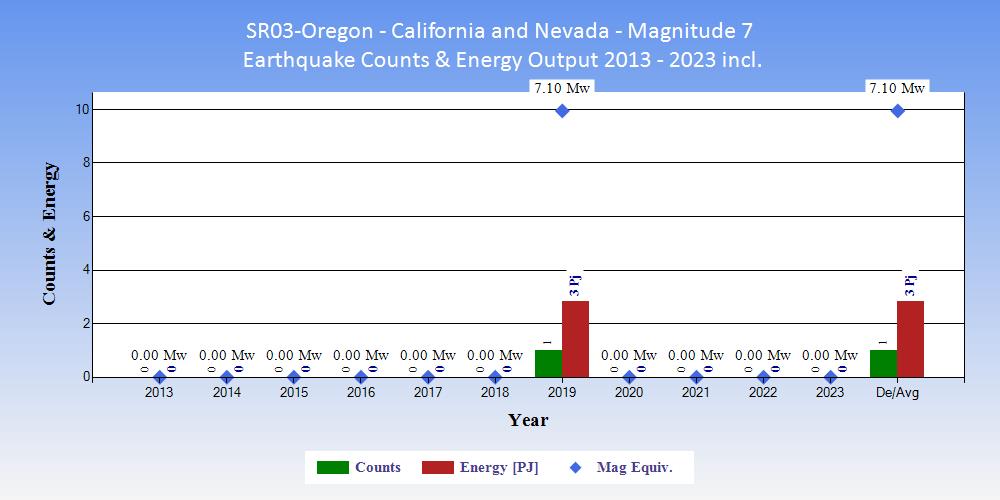
| Tables showing the ranking of 2023 within the 11 years 2013 to 2023 inclusive in terms of counts of earthquakes and energy output. |
|
|
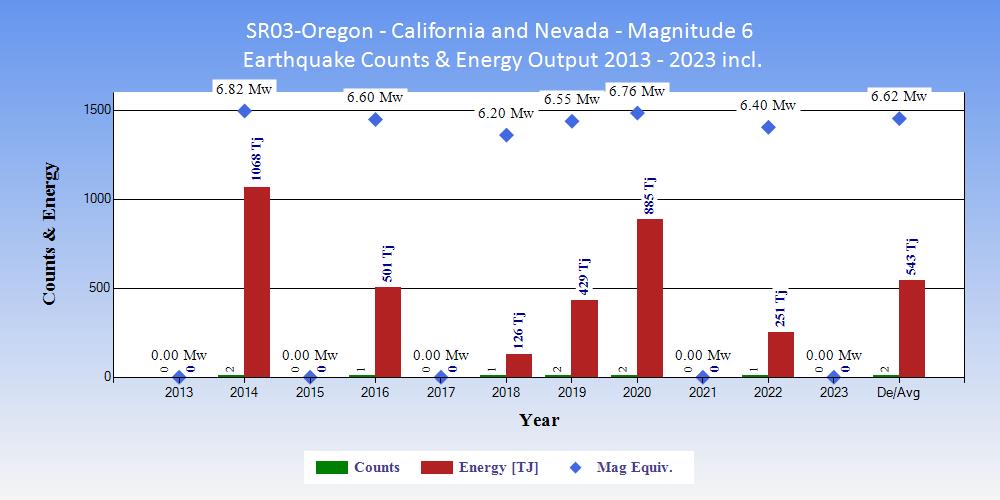
| Tables showing the ranking of 2023 within the 11 years 2013 to 2023 inclusive in terms of counts of earthquakes and energy output. |
|
|
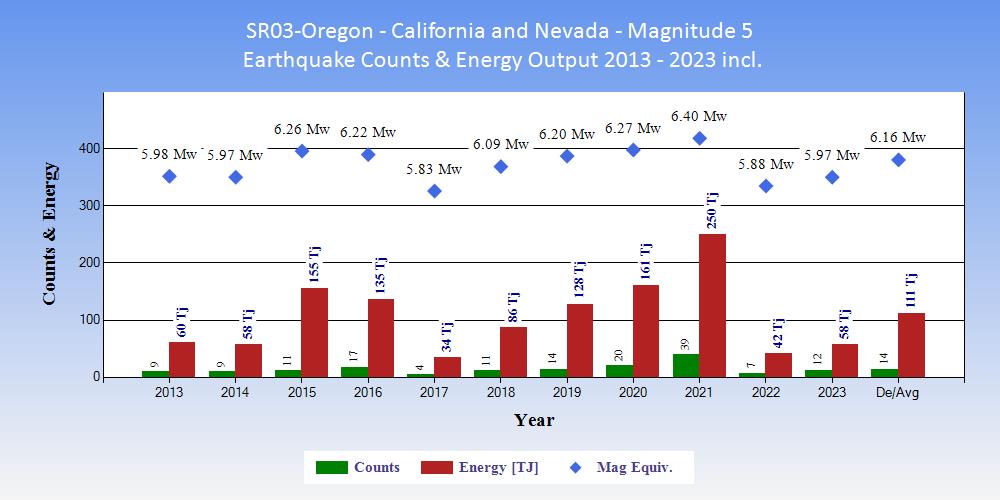
| Tables showing the ranking of 2023 within the 11 years 2013 to 2023 inclusive in terms of counts of earthquakes and energy output. |
|
|
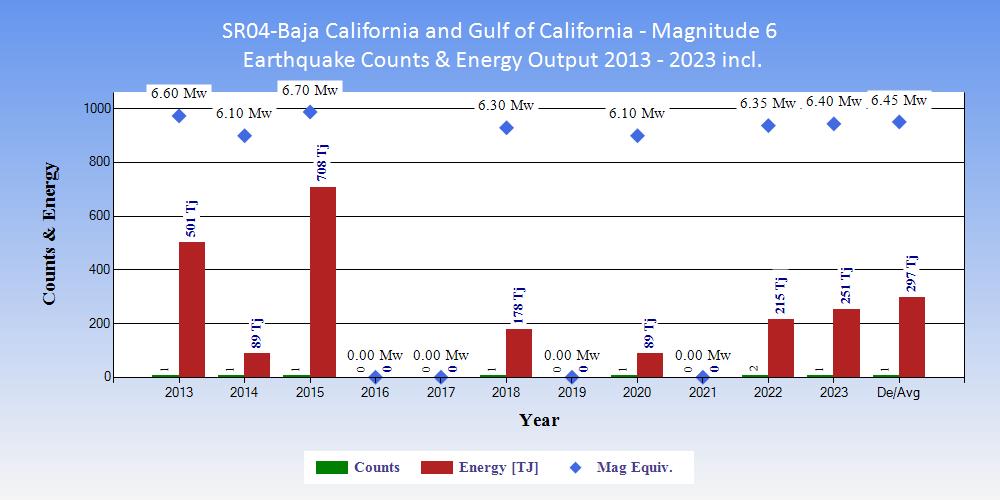
| Tables showing the ranking of 2023 within the 11 years 2013 to 2023 inclusive in terms of counts of earthquakes and energy output. |
|
|
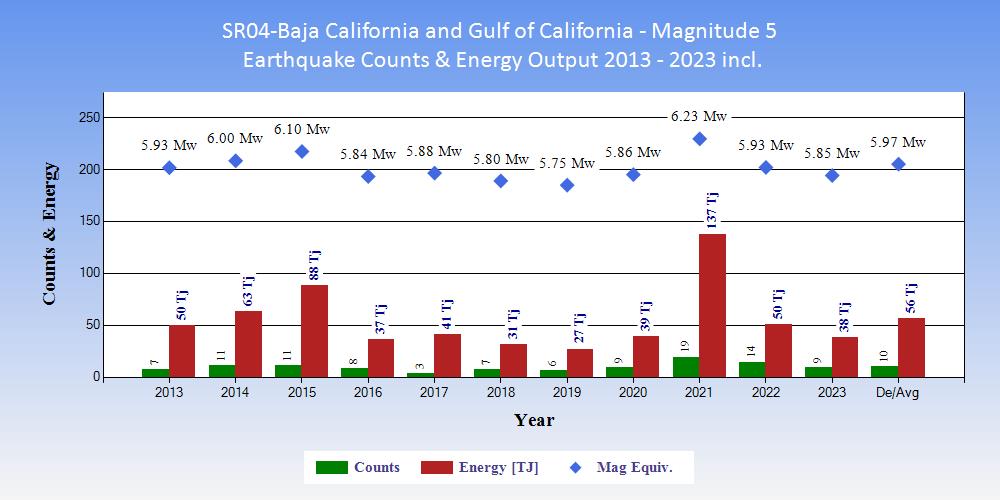
| Tables showing the ranking of 2023 within the 11 years 2013 to 2023 inclusive in terms of counts of earthquakes and energy output. |
|
|
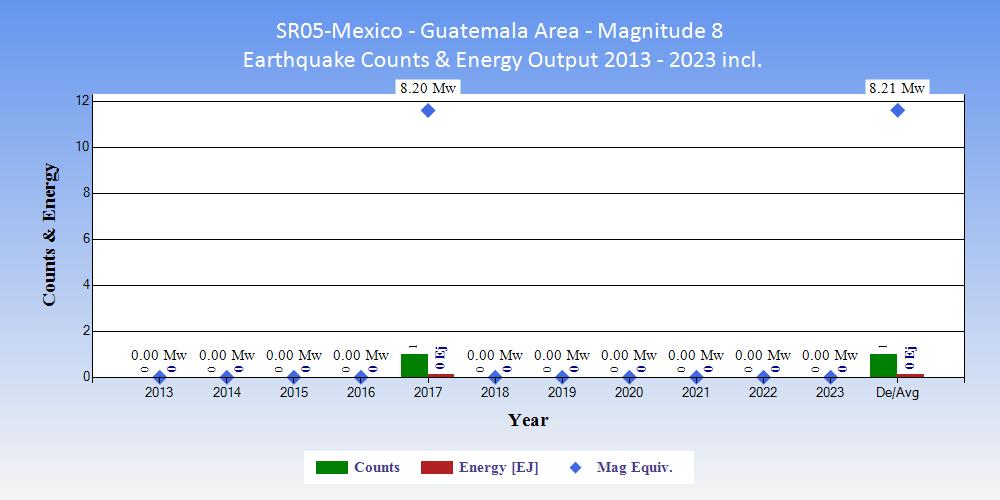
| Tables showing the ranking of 2023 within the 11 years 2013 to 2023 inclusive in terms of counts of earthquakes and energy output. |
|
|
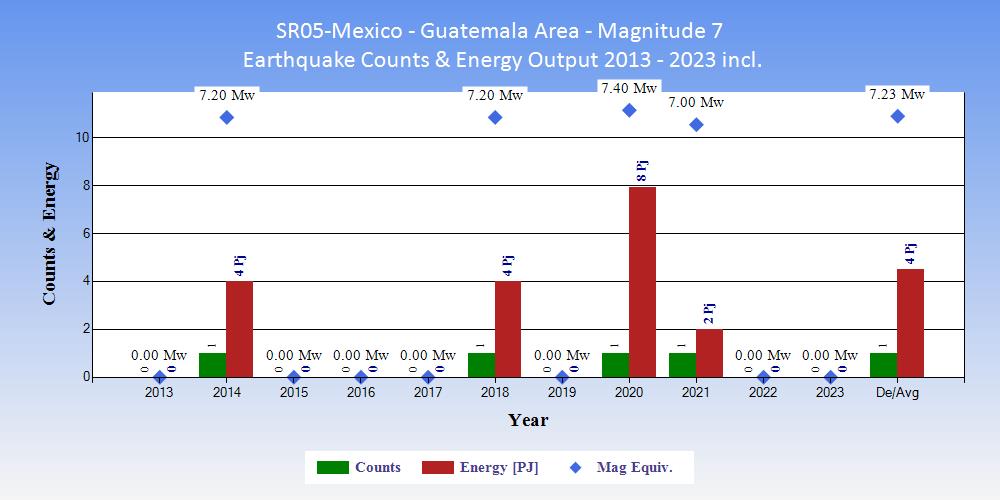
| Tables showing the ranking of 2023 within the 11 years 2013 to 2023 inclusive in terms of counts of earthquakes and energy output. |
|
|
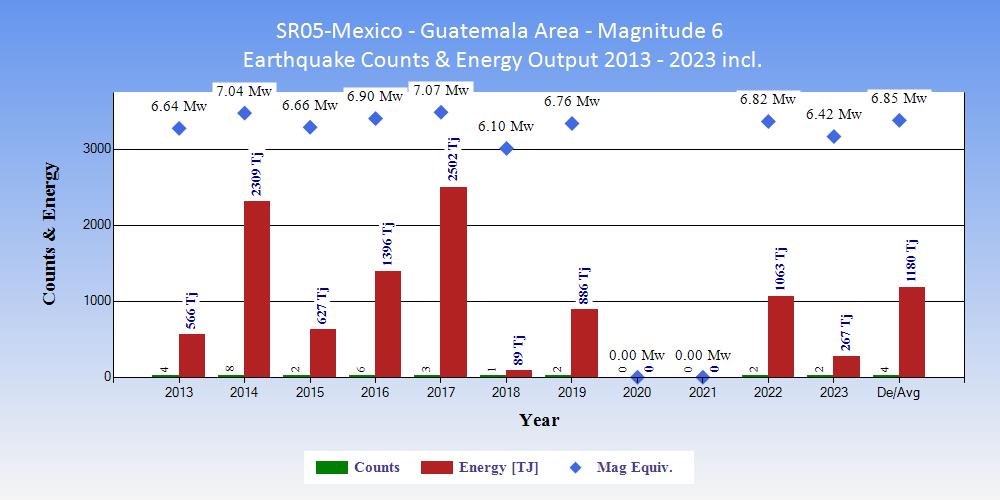
| Tables showing the ranking of 2023 within the 11 years 2013 to 2023 inclusive in terms of counts of earthquakes and energy output. |
|
|
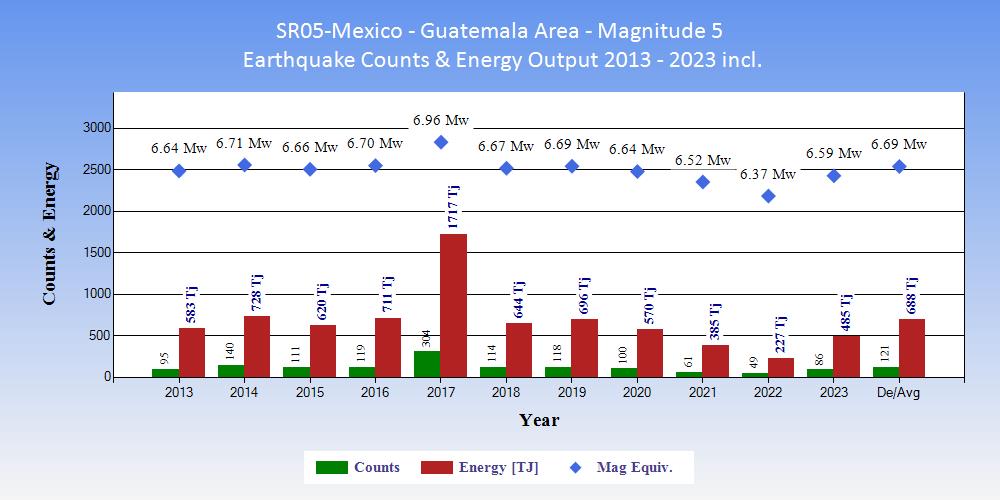
| Tables showing the ranking of 2023 within the 11 years 2013 to 2023 inclusive in terms of counts of earthquakes and energy output. |
|
|
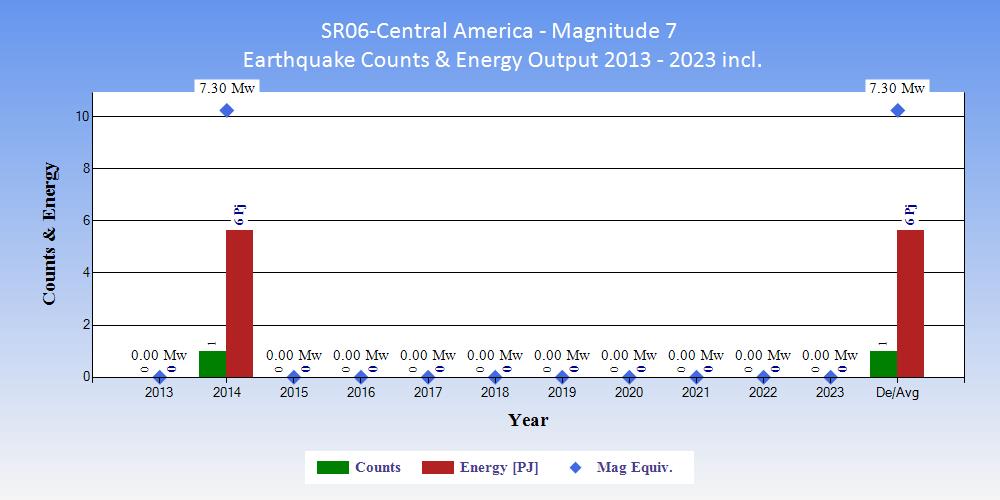
| Tables showing the ranking of 2023 within the 11 years 2013 to 2023 inclusive in terms of counts of earthquakes and energy output. |
|
|
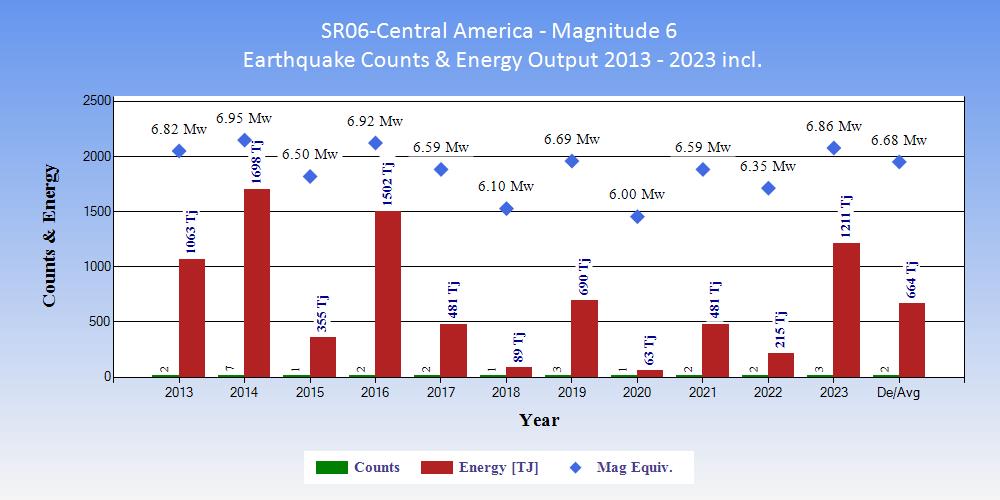
| Tables showing the ranking of 2023 within the 11 years 2013 to 2023 inclusive in terms of counts of earthquakes and energy output. |
|
|
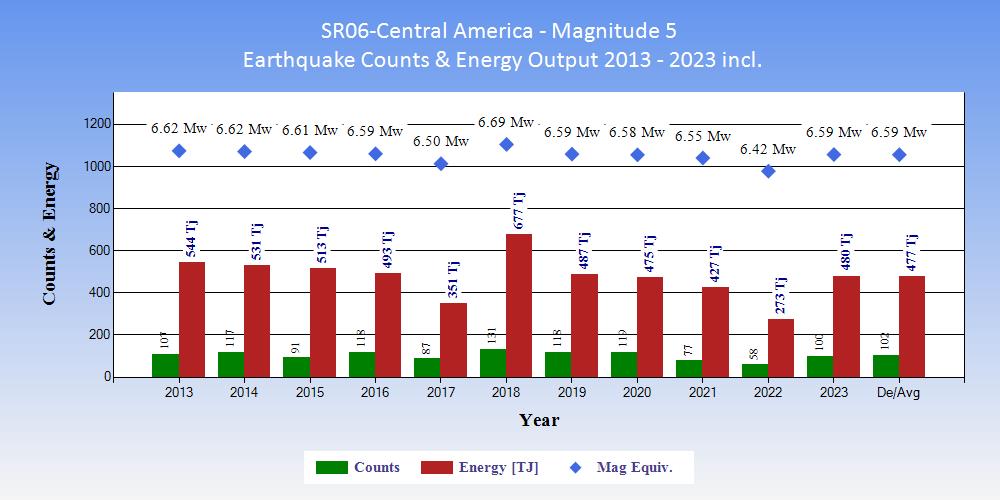
| Tables showing the ranking of 2023 within the 11 years 2013 to 2023 inclusive in terms of counts of earthquakes and energy output. |
|
|
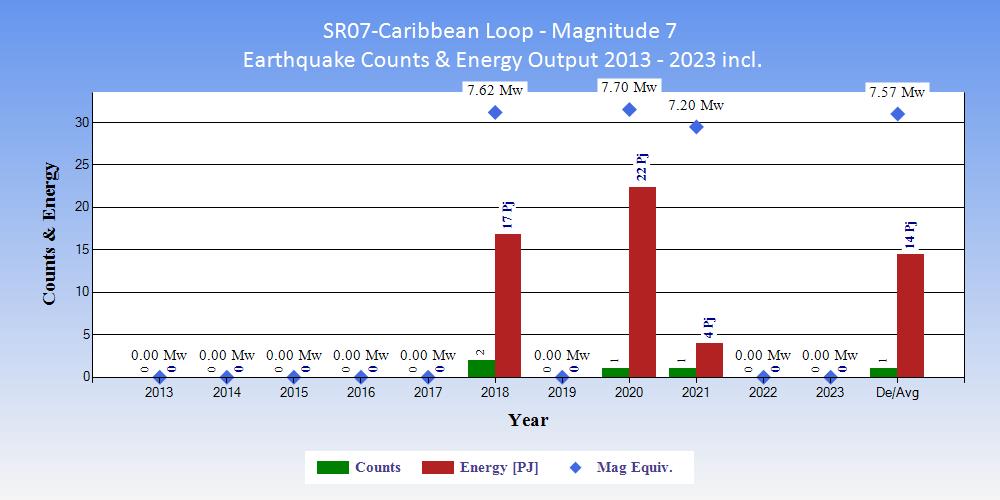
| Tables showing the ranking of 2023 within the 11 years 2013 to 2023 inclusive in terms of counts of earthquakes and energy output. |
|
|
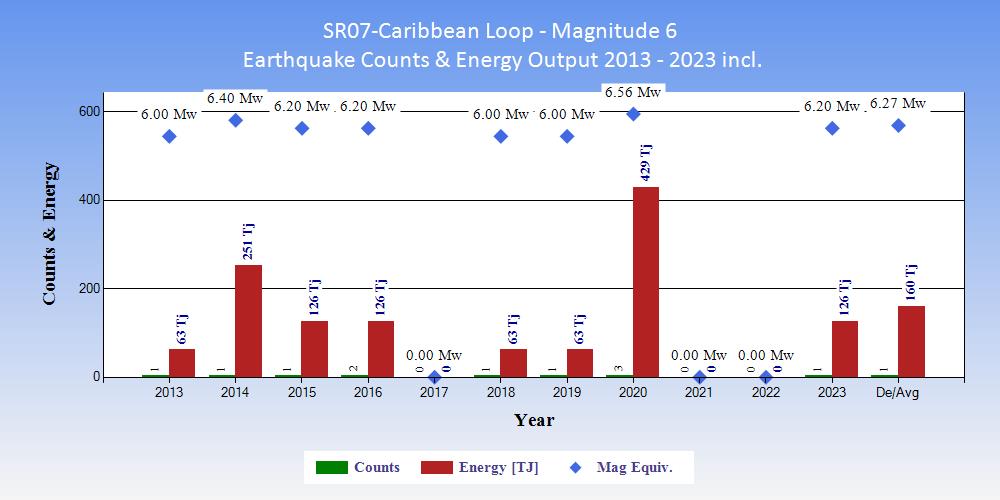
| Tables showing the ranking of 2023 within the 11 years 2013 to 2023 inclusive in terms of counts of earthquakes and energy output. |
|
|
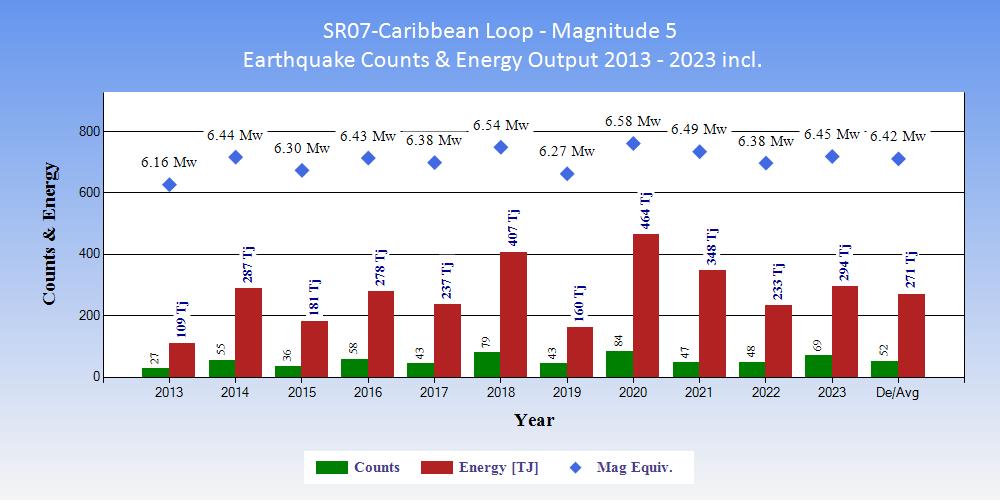
| Tables showing the ranking of 2023 within the 11 years 2013 to 2023 inclusive in terms of counts of earthquakes and energy output. |
|
|
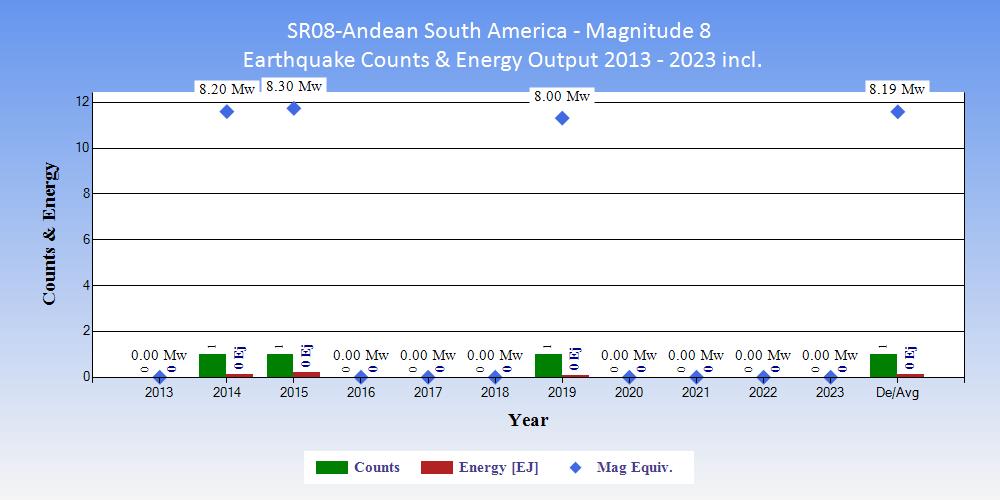
| Tables showing the ranking of 2023 within the 11 years 2013 to 2023 inclusive in terms of counts of earthquakes and energy output. |
|
|
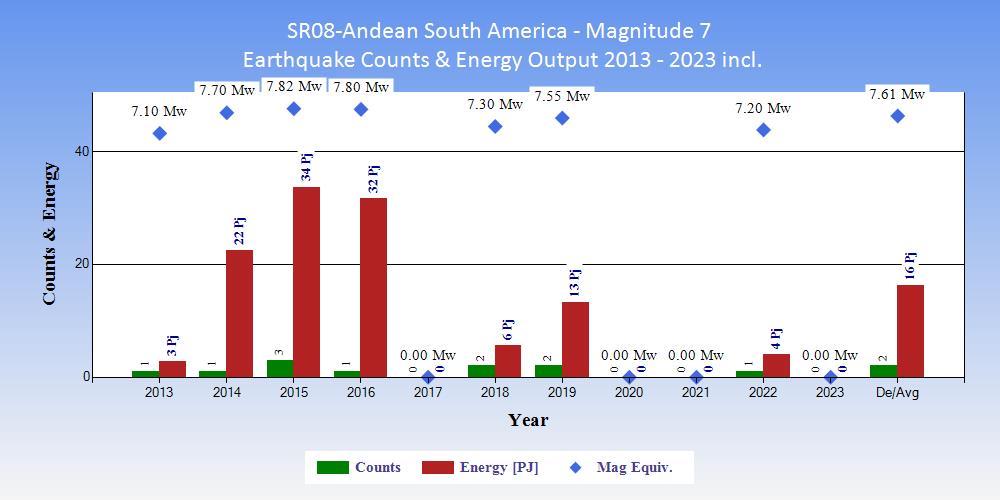
| Tables showing the ranking of 2023 within the 11 years 2013 to 2023 inclusive in terms of counts of earthquakes and energy output. |
|
|
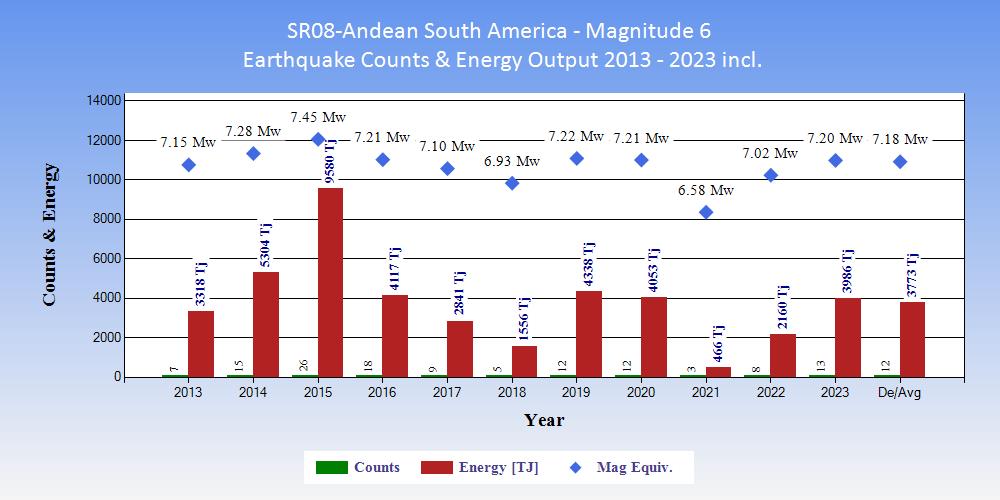
| Tables showing the ranking of 2023 within the 11 years 2013 to 2023 inclusive in terms of counts of earthquakes and energy output. |
|
|
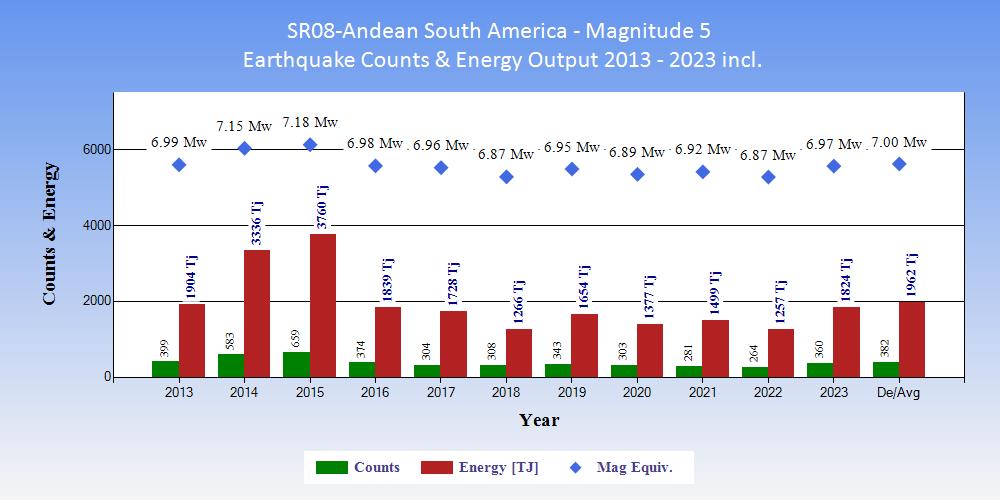
| Tables showing the ranking of 2023 within the 11 years 2013 to 2023 inclusive in terms of counts of earthquakes and energy output. |
|
|
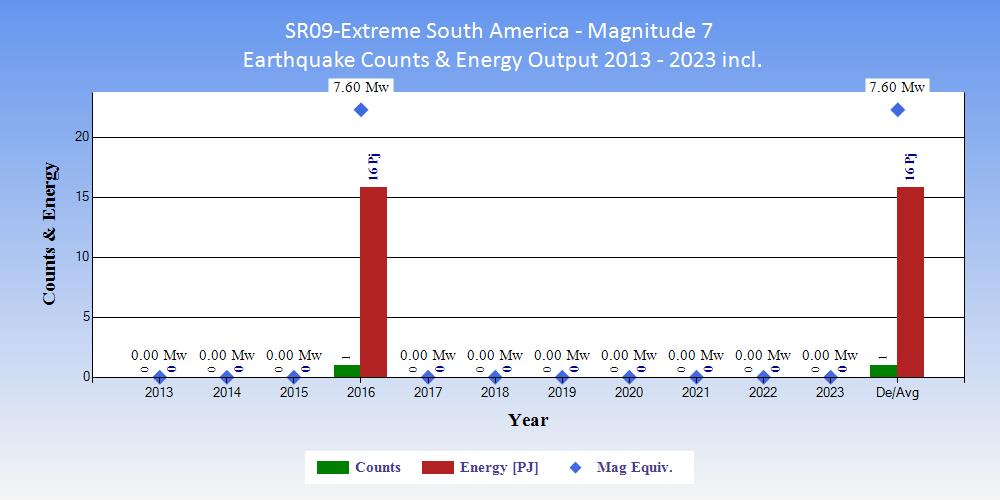
| Tables showing the ranking of 2023 within the 11 years 2013 to 2023 inclusive in terms of counts of earthquakes and energy output. |
|
|
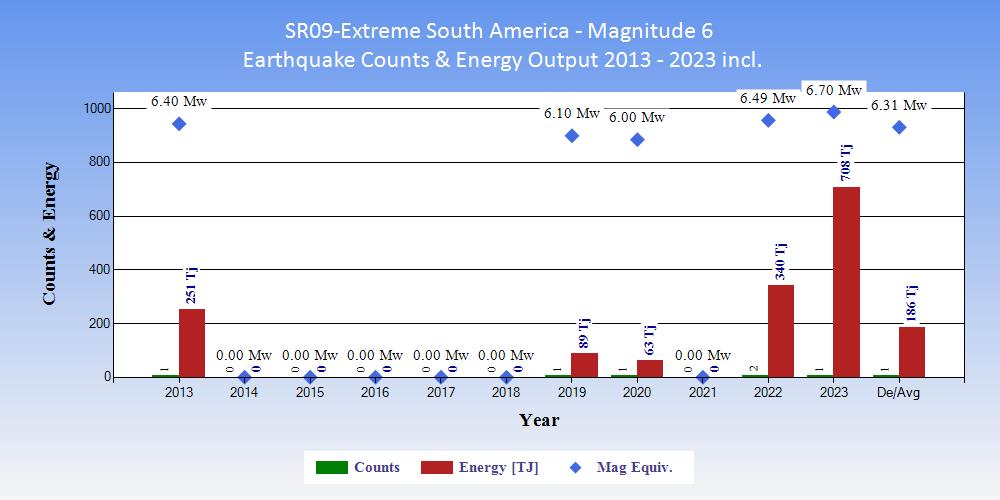
| Tables showing the ranking of 2023 within the 11 years 2013 to 2023 inclusive in terms of counts of earthquakes and energy output. |
|
|
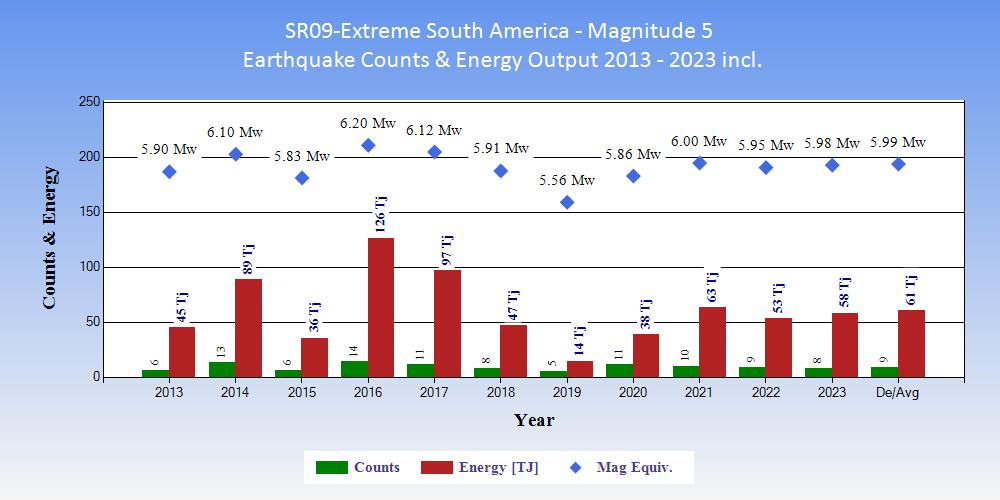
| Tables showing the ranking of 2023 within the 11 years 2013 to 2023 inclusive in terms of counts of earthquakes and energy output. |
|
|
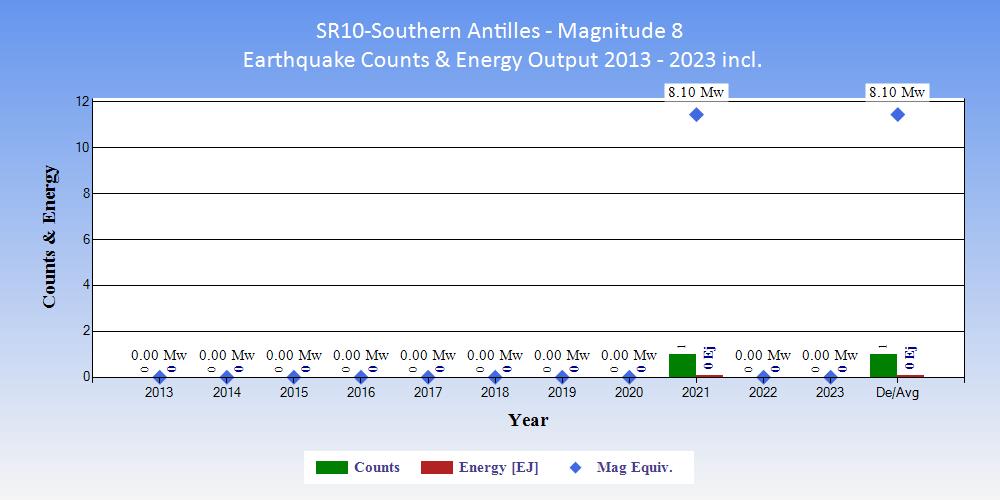
| Tables showing the ranking of 2023 within the 11 years 2013 to 2023 inclusive in terms of counts of earthquakes and energy output. |
|
|
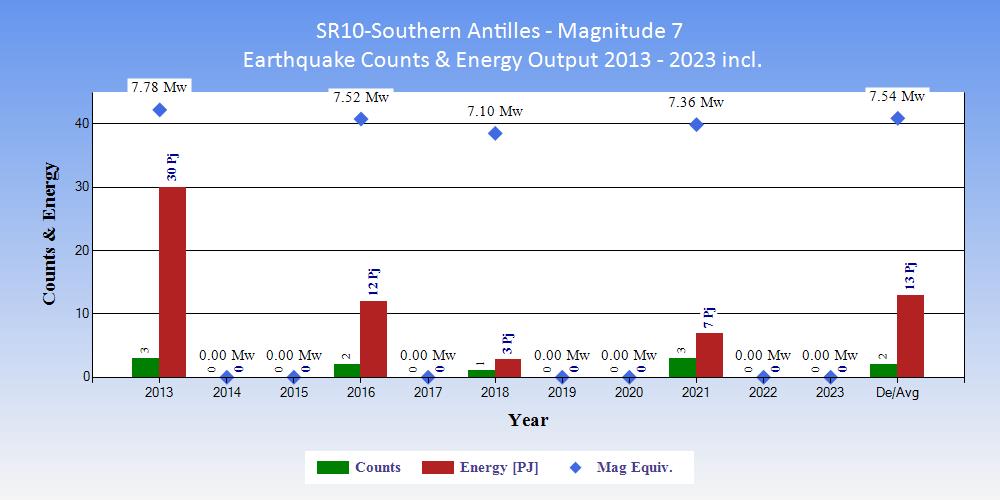
| Tables showing the ranking of 2023 within the 11 years 2013 to 2023 inclusive in terms of counts of earthquakes and energy output. |
|
|
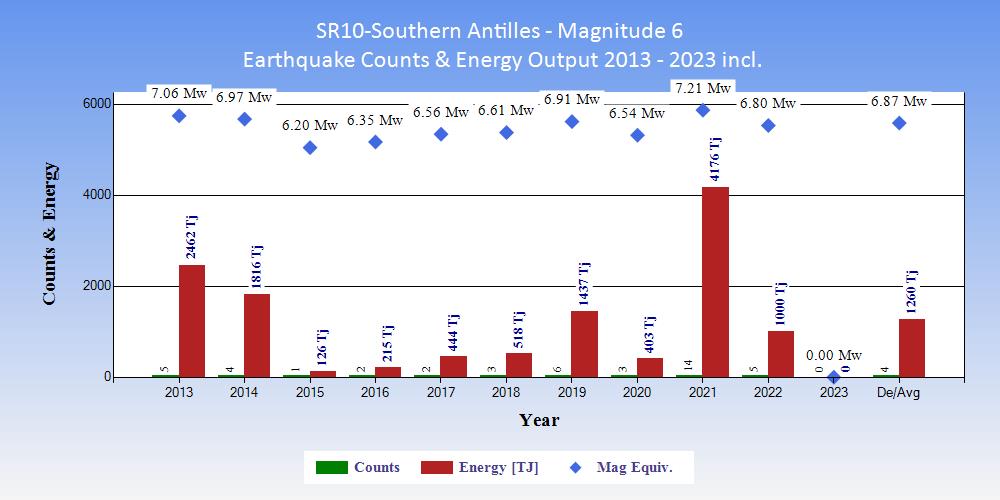
| Tables showing the ranking of 2023 within the 11 years 2013 to 2023 inclusive in terms of counts of earthquakes and energy output. |
|
|
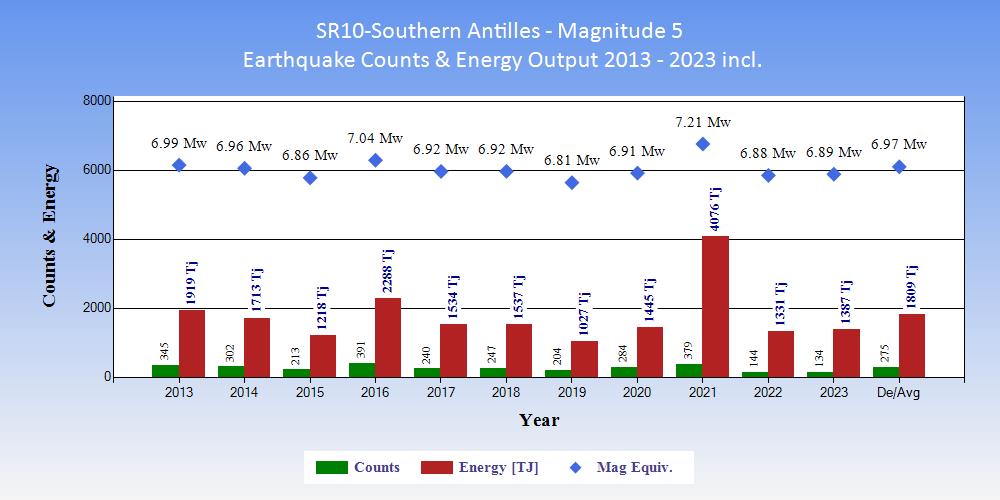
| Tables showing the ranking of 2023 within the 11 years 2013 to 2023 inclusive in terms of counts of earthquakes and energy output. |
|
|
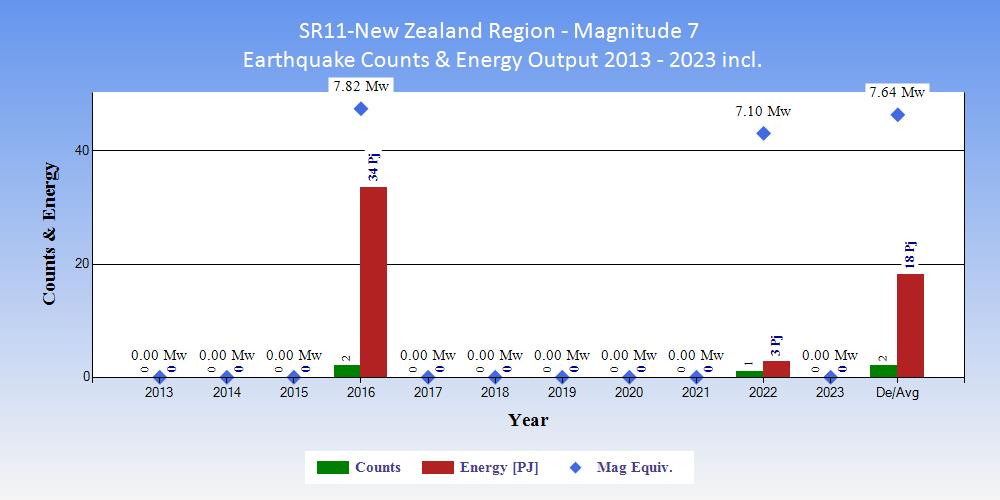
| Tables showing the ranking of 2023 within the 11 years 2013 to 2023 inclusive in terms of counts of earthquakes and energy output. |
|
|
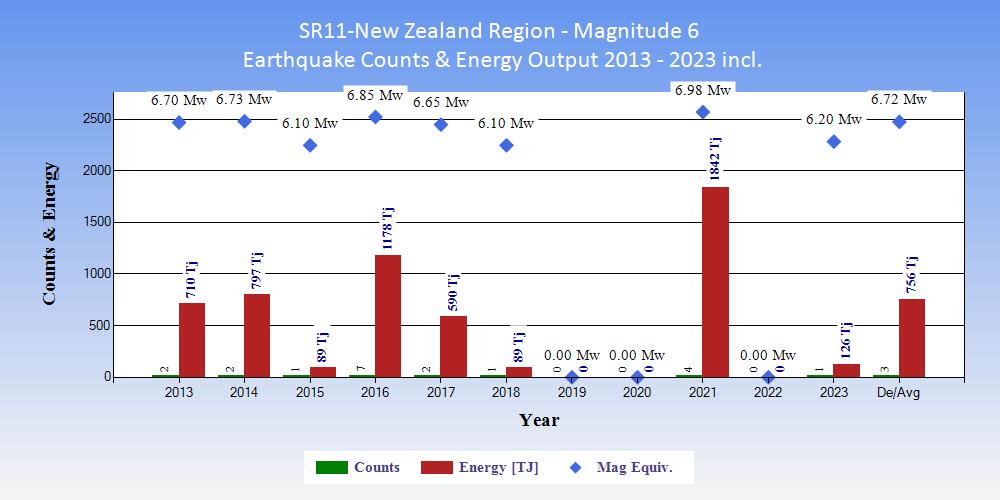
| Tables showing the ranking of 2023 within the 11 years 2013 to 2023 inclusive in terms of counts of earthquakes and energy output. |
|
|
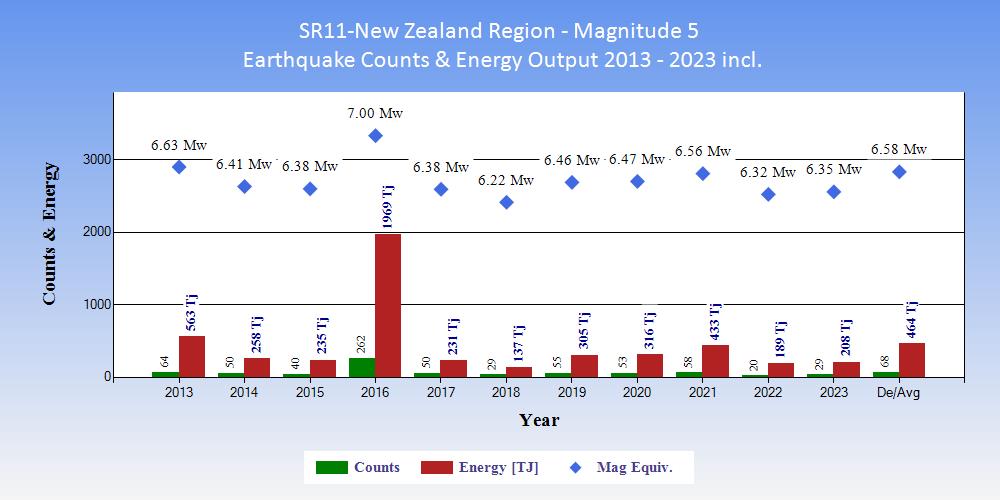
| Tables showing the ranking of 2023 within the 11 years 2013 to 2023 inclusive in terms of counts of earthquakes and energy output. |
|
|
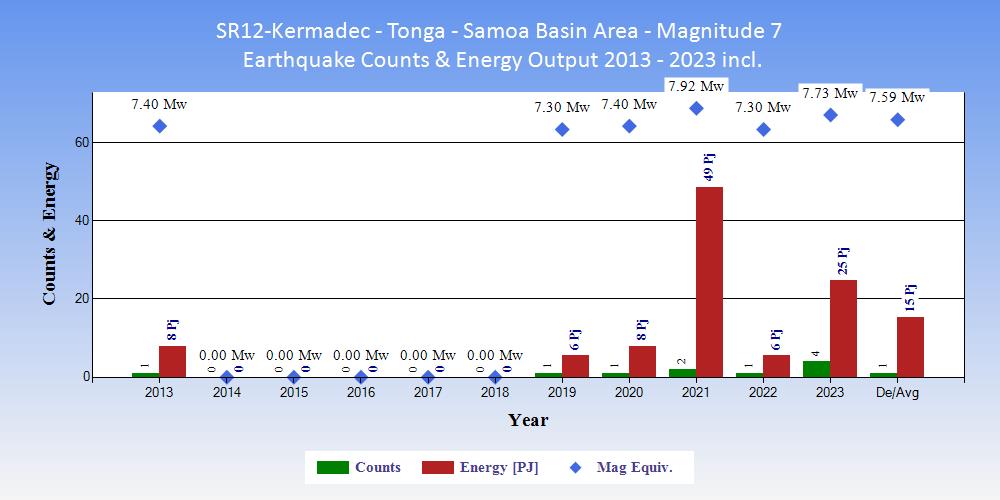
| Tables showing the ranking of 2023 within the 11 years 2013 to 2023 inclusive in terms of counts of earthquakes and energy output. |
|
|
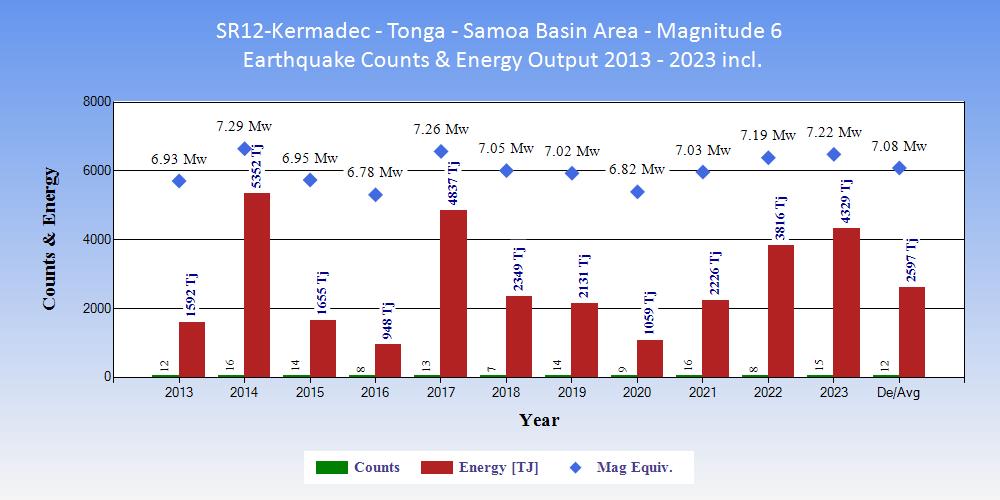
| Tables showing the ranking of 2023 within the 11 years 2013 to 2023 inclusive in terms of counts of earthquakes and energy output. |
|
|
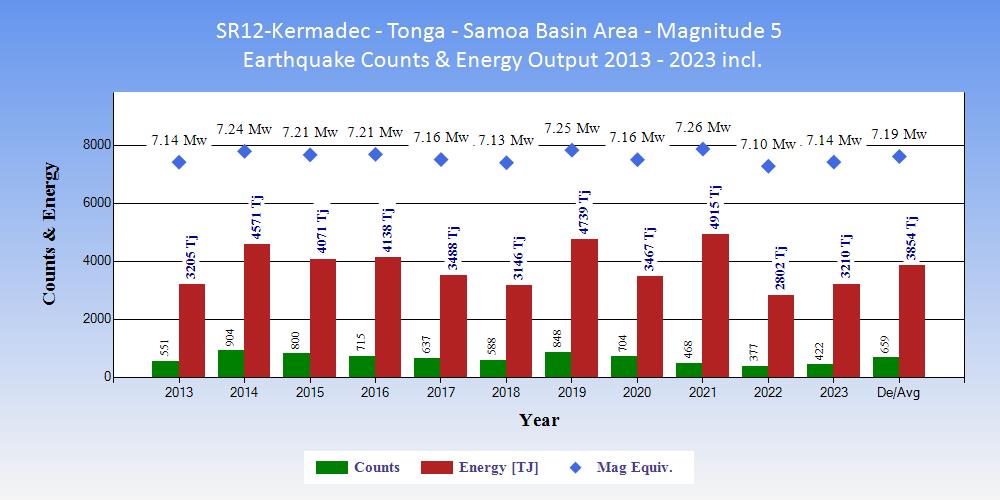
| Tables showing the ranking of 2023 within the 11 years 2013 to 2023 inclusive in terms of counts of earthquakes and energy output. |
|
|
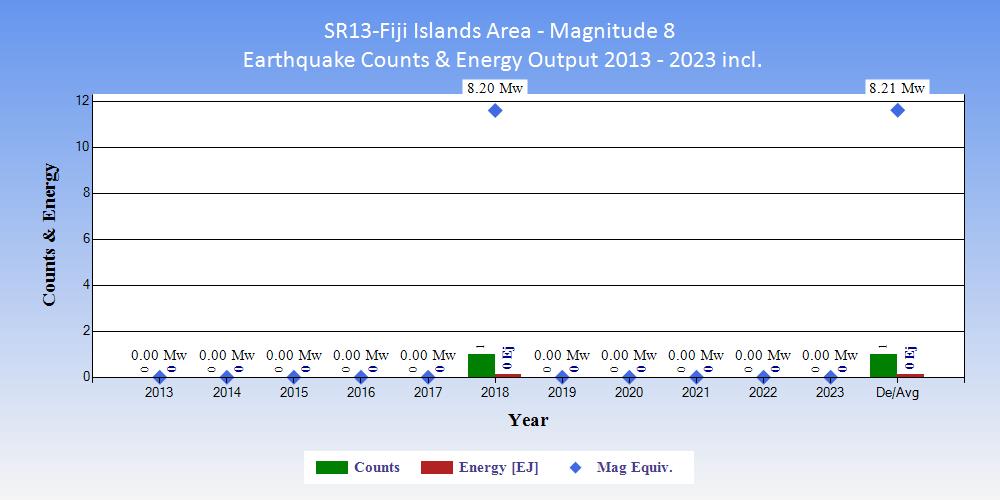
| Tables showing the ranking of 2023 within the 11 years 2013 to 2023 inclusive in terms of counts of earthquakes and energy output. |
|
|
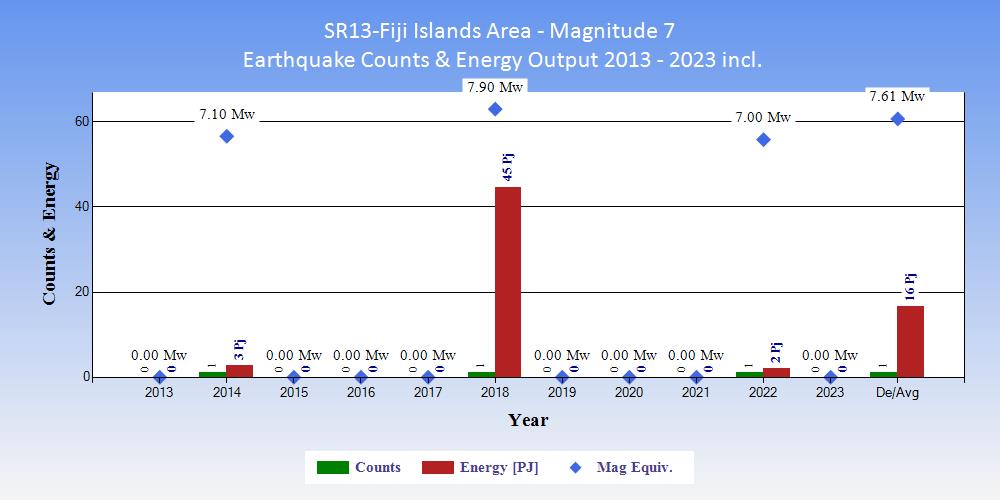
| Tables showing the ranking of 2023 within the 11 years 2013 to 2023 inclusive in terms of counts of earthquakes and energy output. |
|
|
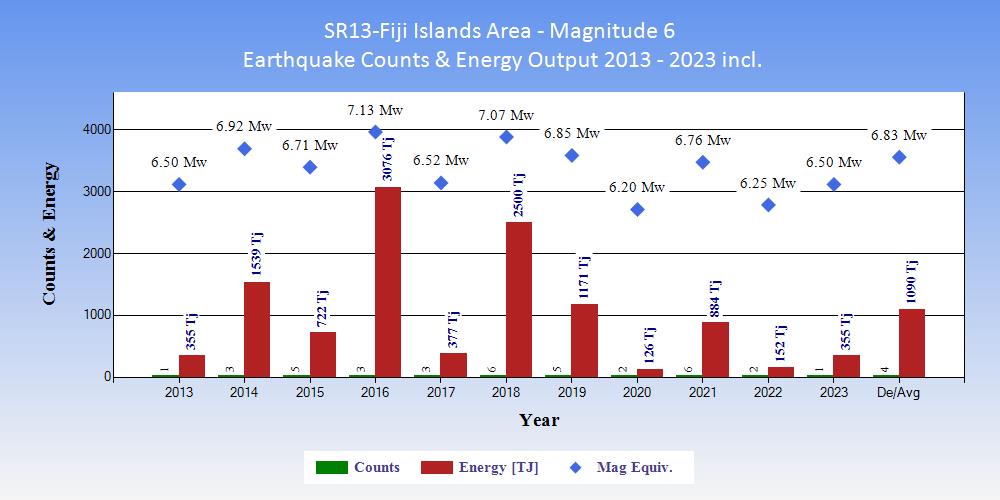
| Tables showing the ranking of 2023 within the 11 years 2013 to 2023 inclusive in terms of counts of earthquakes and energy output. |
|
|
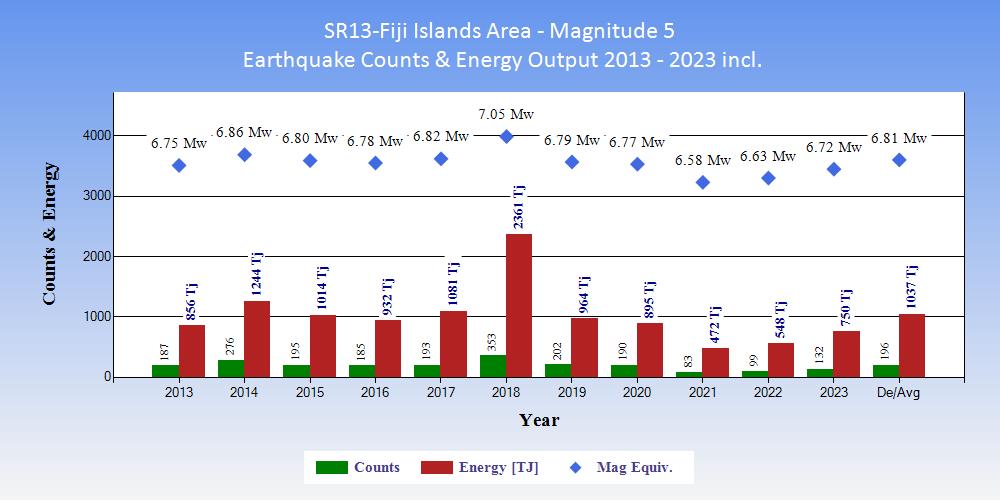
| Tables showing the ranking of 2023 within the 11 years 2013 to 2023 inclusive in terms of counts of earthquakes and energy output. |
|
|
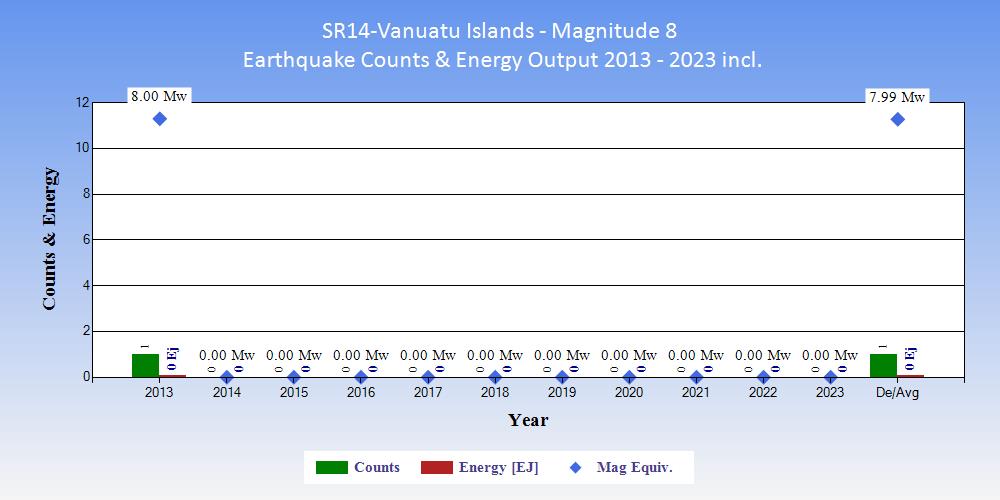
| Tables showing the ranking of 2023 within the 11 years 2013 to 2023 inclusive in terms of counts of earthquakes and energy output. |
|
|
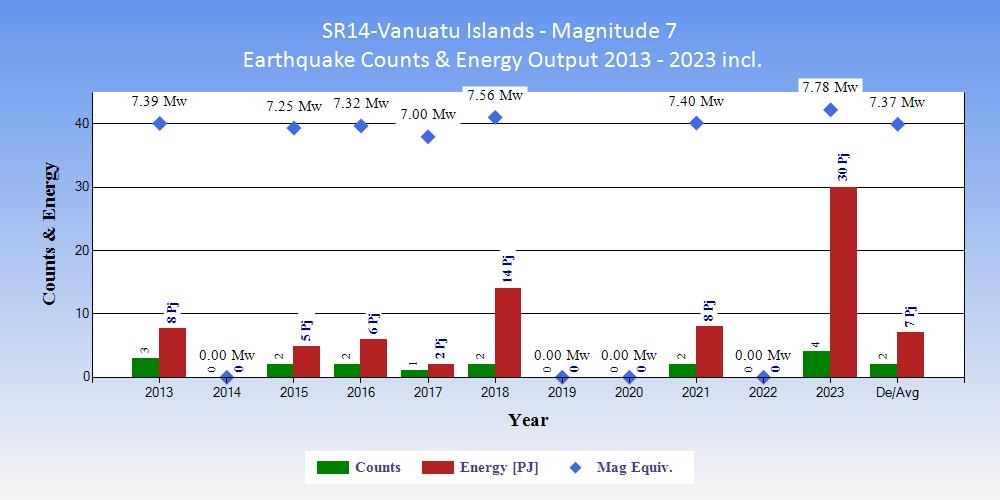
| Tables showing the ranking of 2023 within the 11 years 2013 to 2023 inclusive in terms of counts of earthquakes and energy output. |
|
|
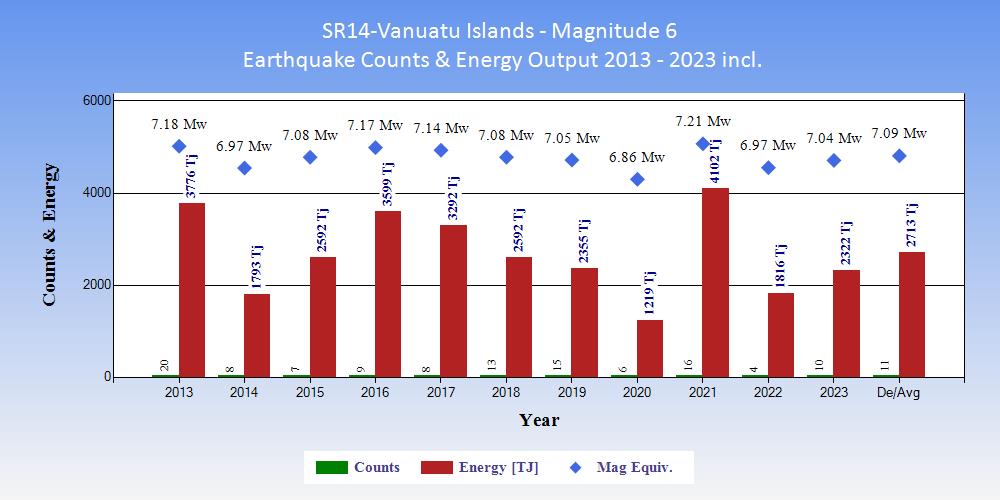
| Tables showing the ranking of 2023 within the 11 years 2013 to 2023 inclusive in terms of counts of earthquakes and energy output. |
|
|
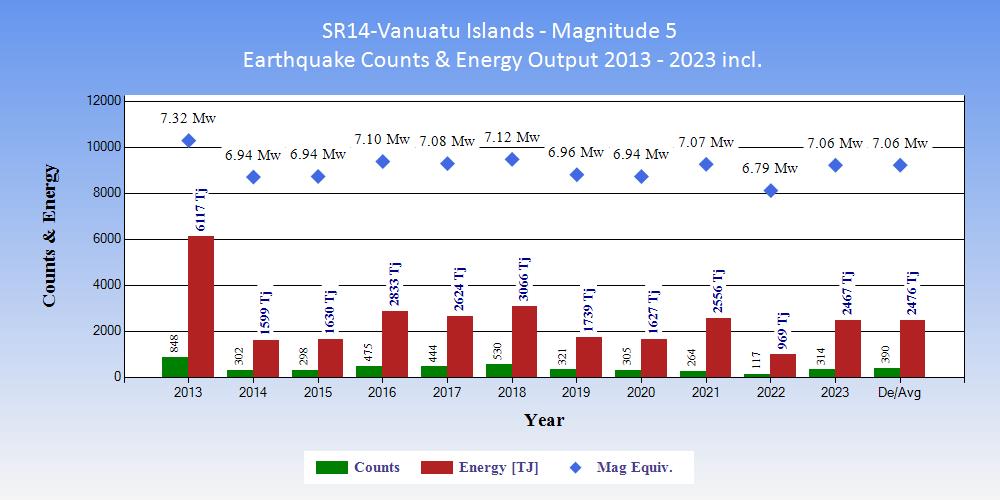
| Tables showing the ranking of 2023 within the 11 years 2013 to 2023 inclusive in terms of counts of earthquakes and energy output. |
|
|
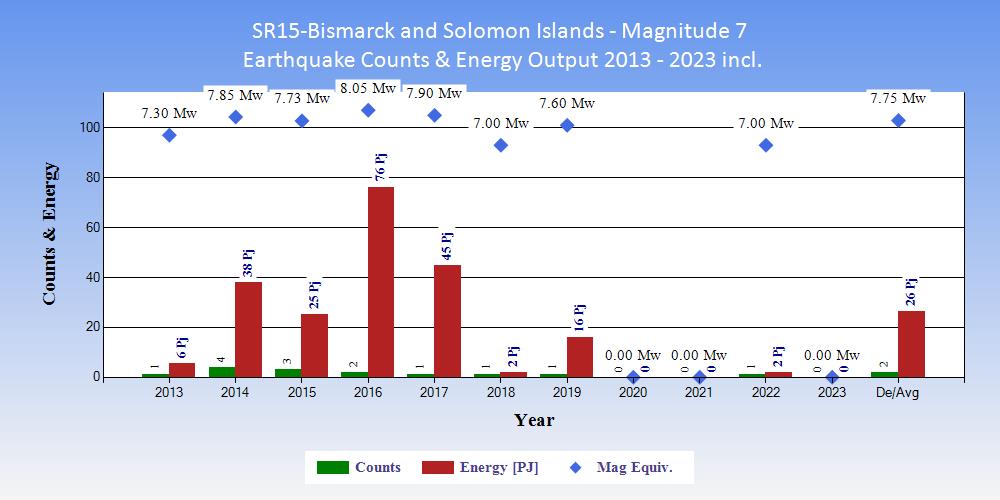
| Tables showing the ranking of 2023 within the 11 years 2013 to 2023 inclusive in terms of counts of earthquakes and energy output. |
|
|
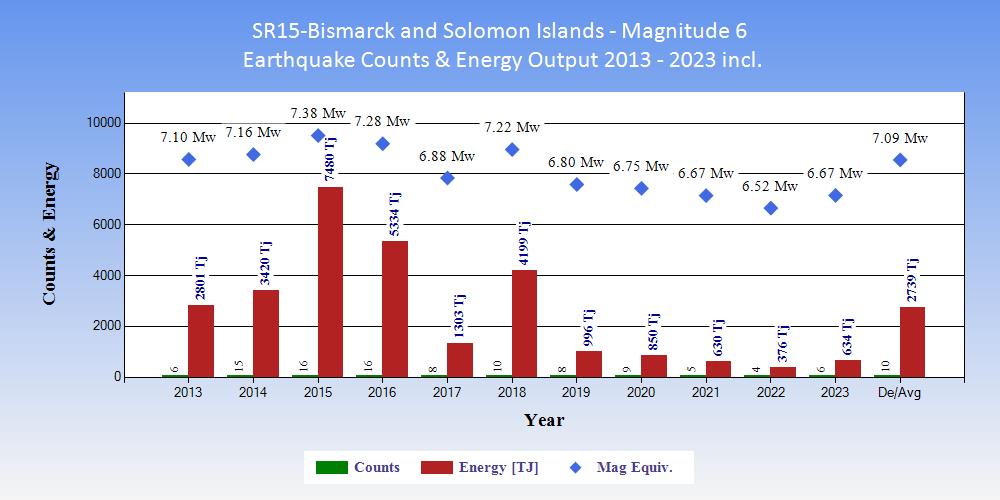
| Tables showing the ranking of 2023 within the 11 years 2013 to 2023 inclusive in terms of counts of earthquakes and energy output. |
|
|
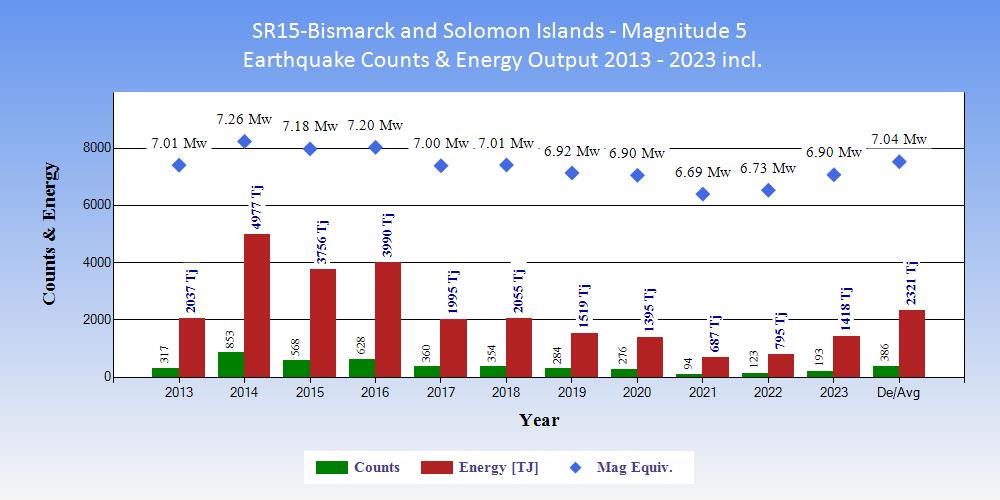
| Tables showing the ranking of 2023 within the 11 years 2013 to 2023 inclusive in terms of counts of earthquakes and energy output. |
|
|
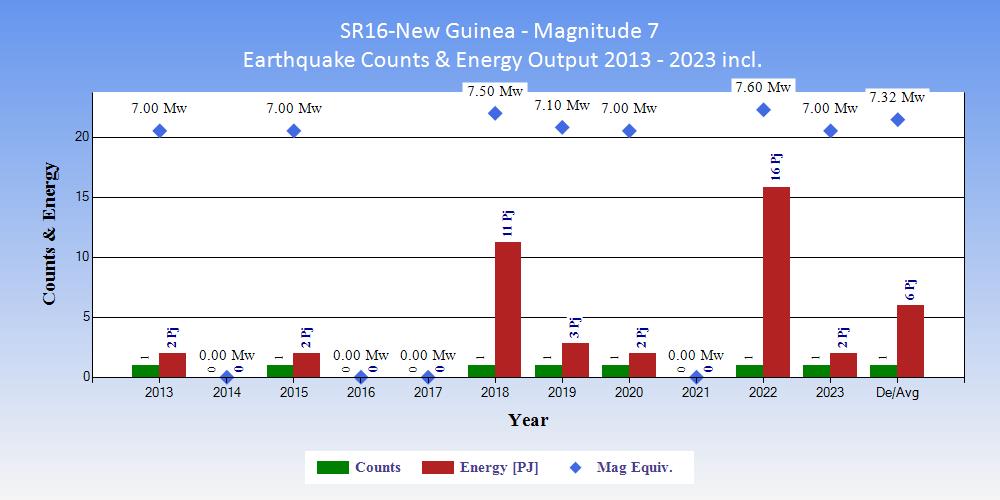
| Tables showing the ranking of 2023 within the 11 years 2013 to 2023 inclusive in terms of counts of earthquakes and energy output. |
|
|
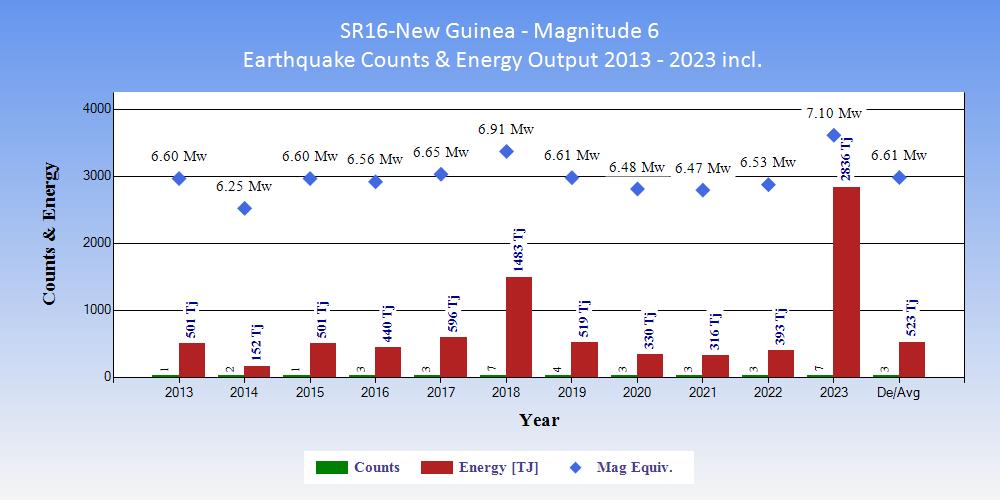
| Tables showing the ranking of 2023 within the 11 years 2013 to 2023 inclusive in terms of counts of earthquakes and energy output. |
|
|
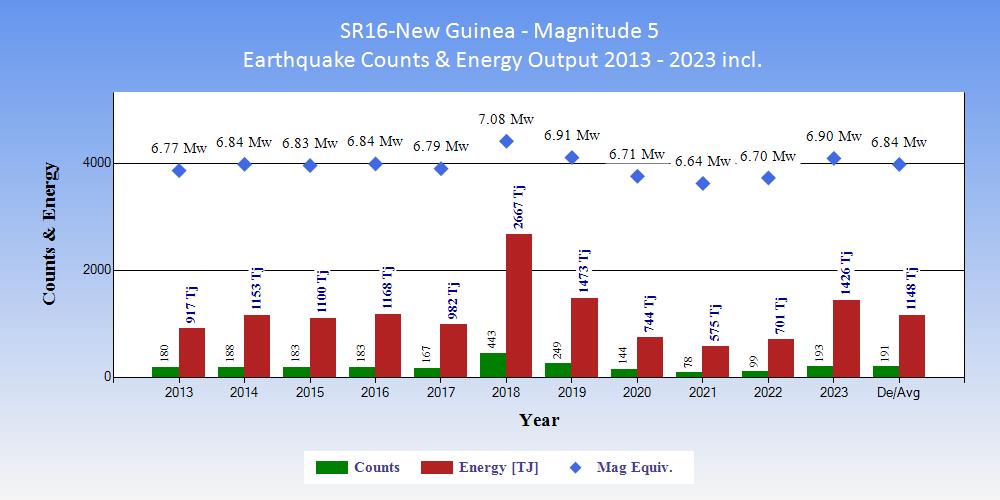
| Tables showing the ranking of 2023 within the 11 years 2013 to 2023 inclusive in terms of counts of earthquakes and energy output. |
|
|
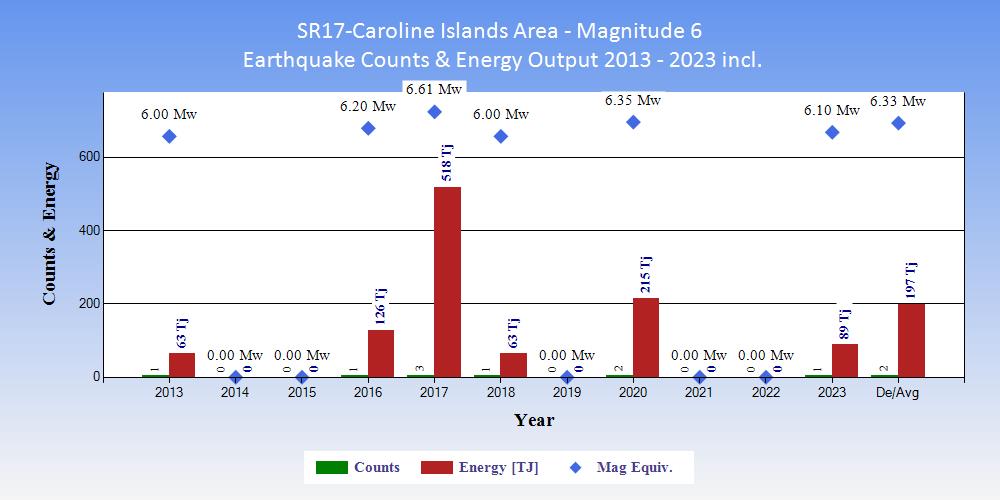
| Tables showing the ranking of 2023 within the 11 years 2013 to 2023 inclusive in terms of counts of earthquakes and energy output. |
|
|
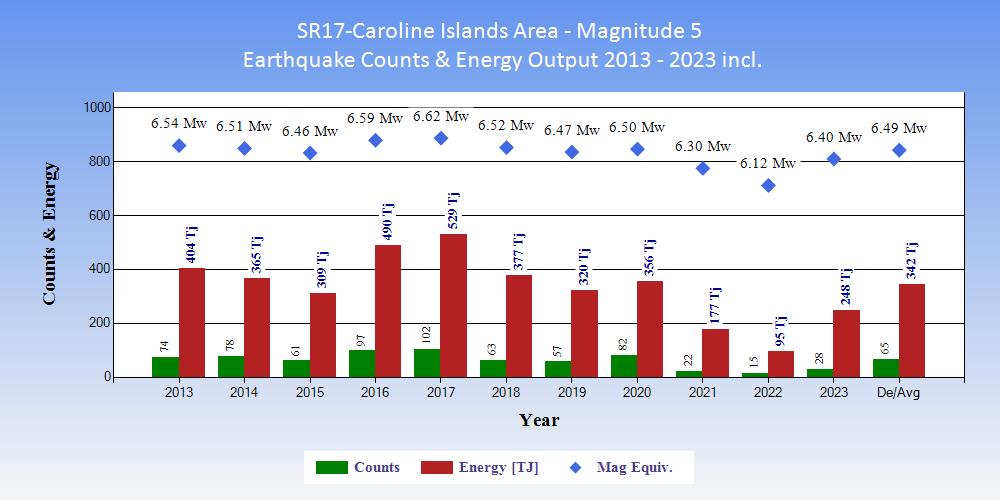
| Tables showing the ranking of 2023 within the 11 years 2013 to 2023 inclusive in terms of counts of earthquakes and energy output. |
|
|
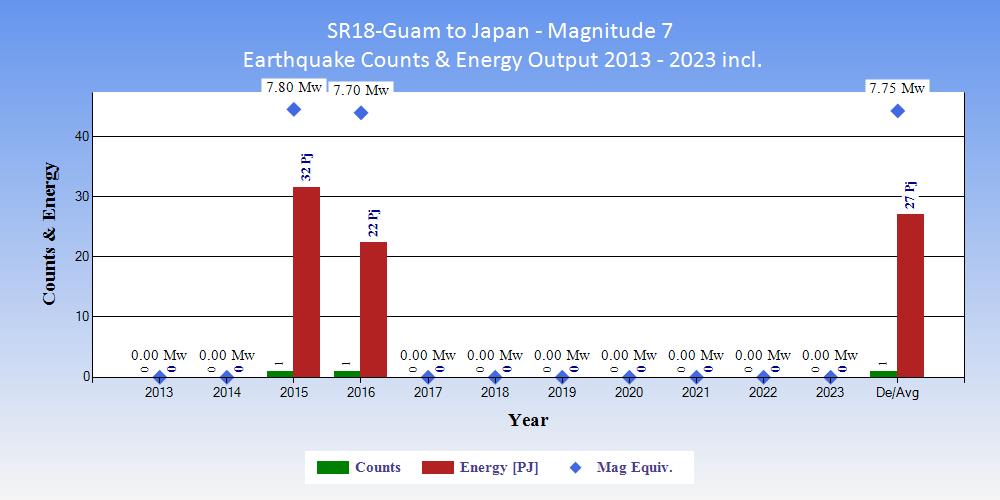
| Tables showing the ranking of 2023 within the 11 years 2013 to 2023 inclusive in terms of counts of earthquakes and energy output. |
|
|
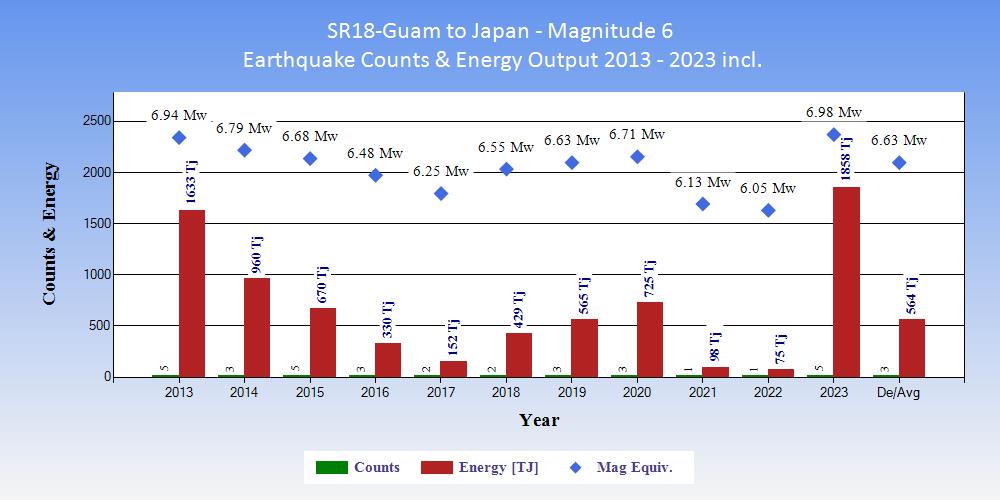
| Tables showing the ranking of 2023 within the 11 years 2013 to 2023 inclusive in terms of counts of earthquakes and energy output. |
|
|
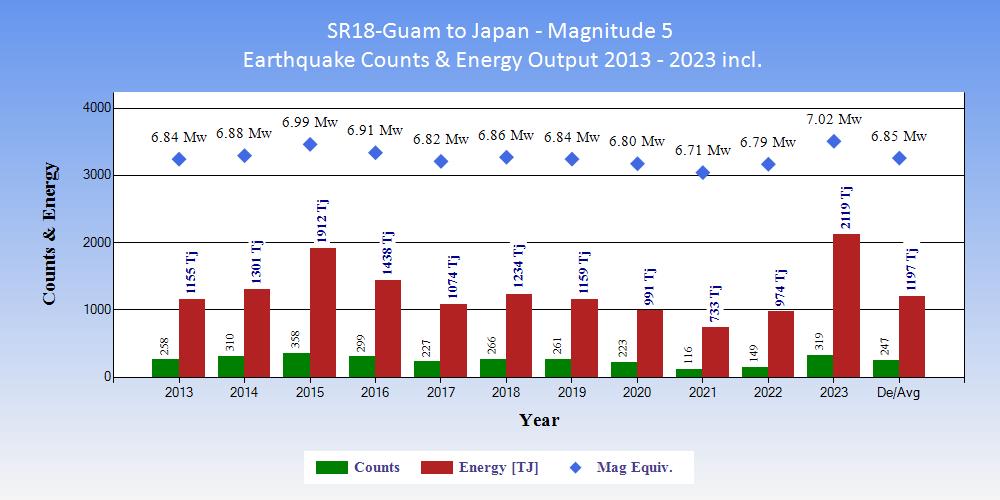
| Tables showing the ranking of 2023 within the 11 years 2013 to 2023 inclusive in terms of counts of earthquakes and energy output. |
|
|
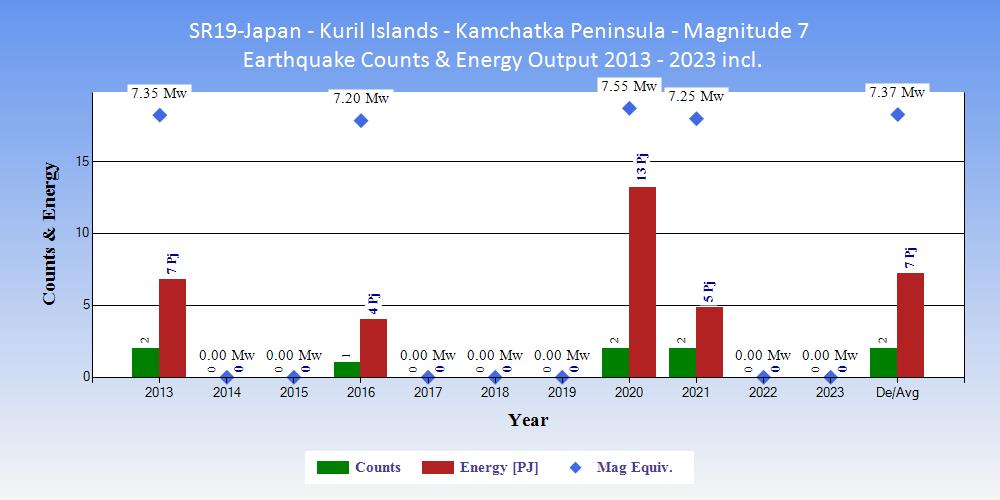
| Tables showing the ranking of 2023 within the 11 years 2013 to 2023 inclusive in terms of counts of earthquakes and energy output. |
|
|
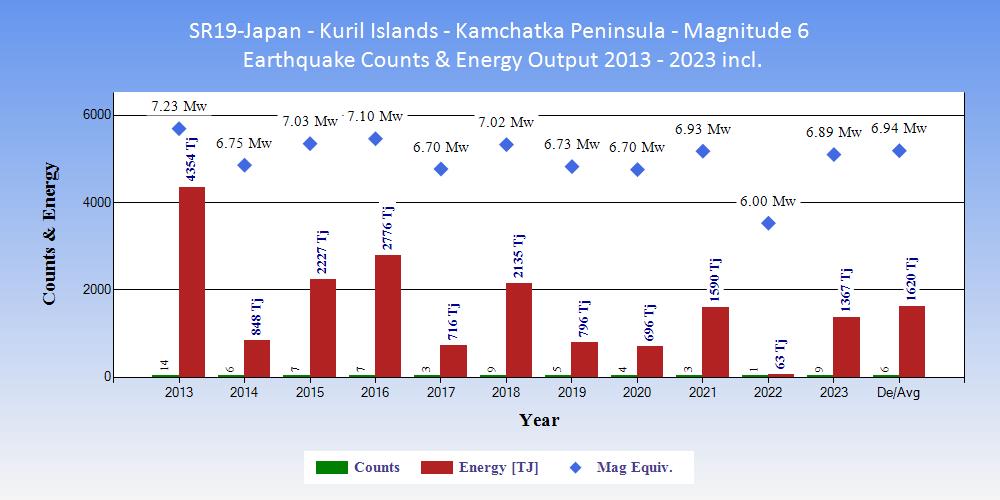
| Tables showing the ranking of 2023 within the 11 years 2013 to 2023 inclusive in terms of counts of earthquakes and energy output. |
|
|
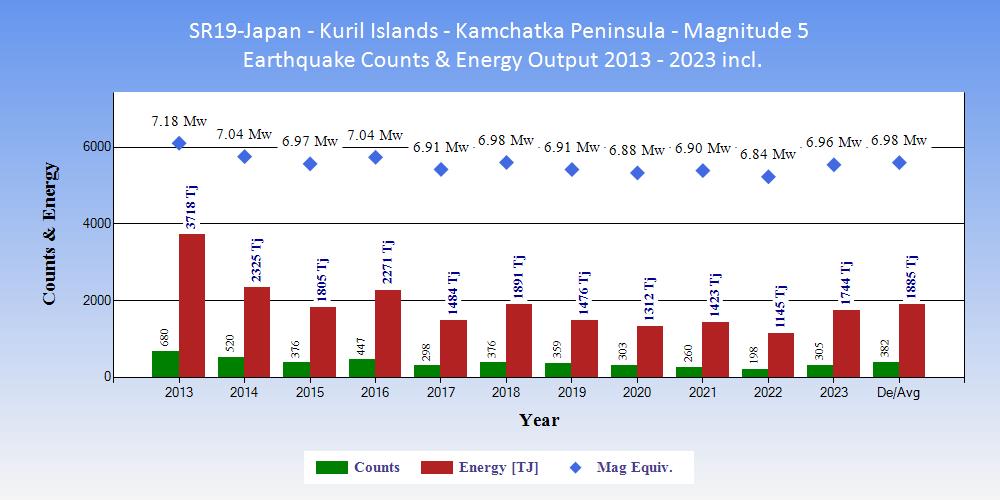
| Tables showing the ranking of 2023 within the 11 years 2013 to 2023 inclusive in terms of counts of earthquakes and energy output. |
|
|
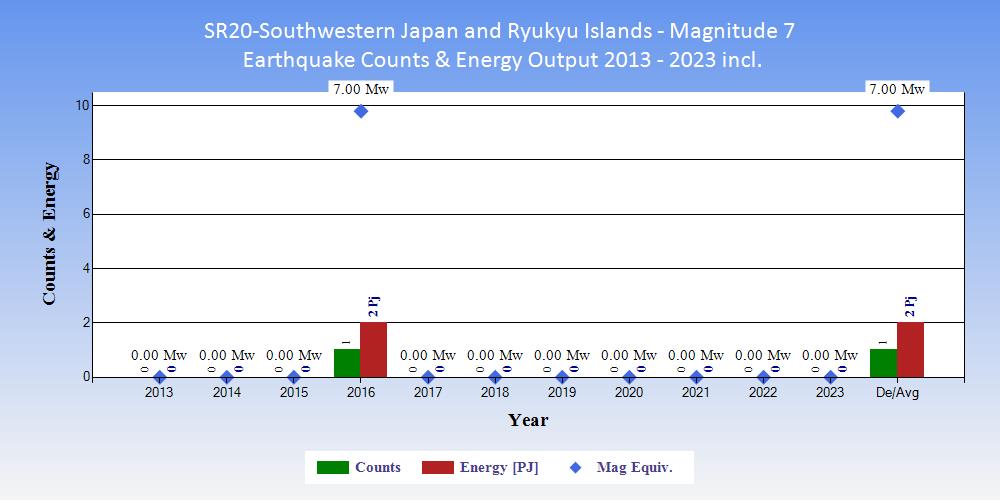
| Tables showing the ranking of 2023 within the 11 years 2013 to 2023 inclusive in terms of counts of earthquakes and energy output. |
|
|
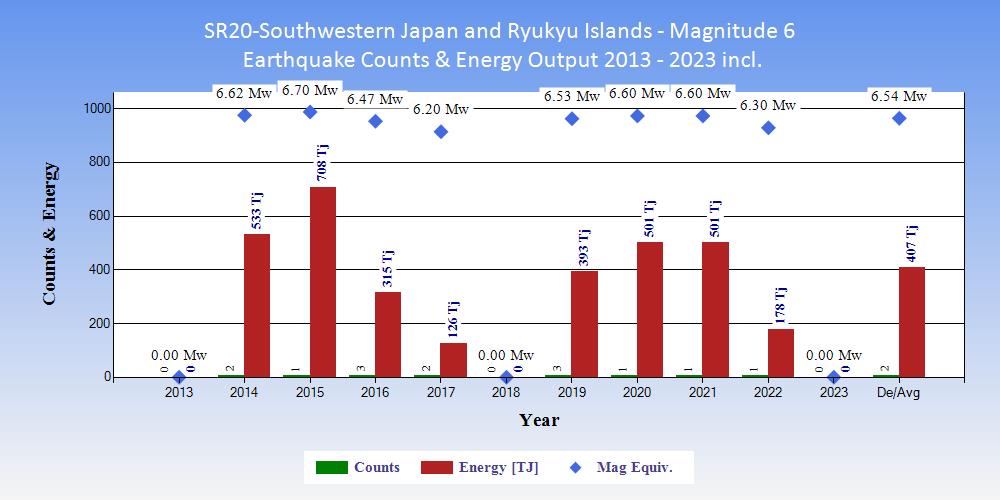
| Tables showing the ranking of 2023 within the 11 years 2013 to 2023 inclusive in terms of counts of earthquakes and energy output. |
|
|
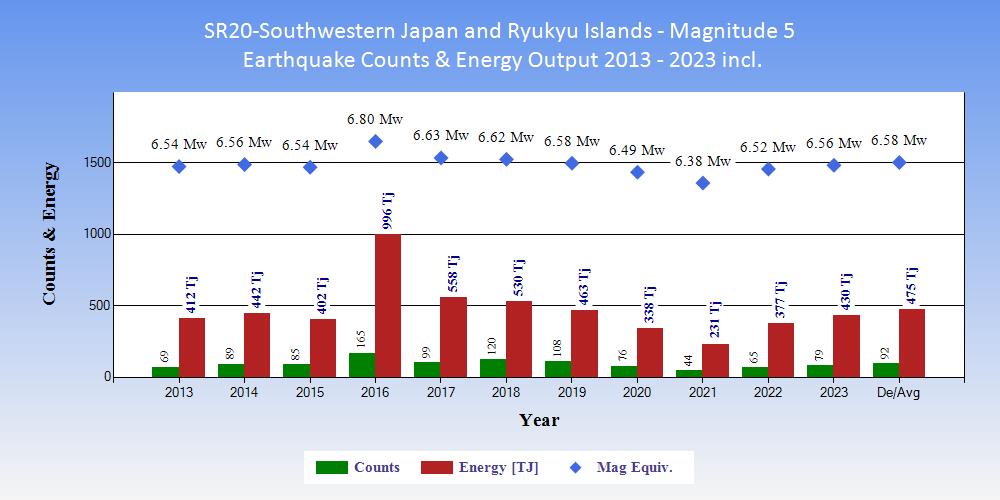
| Tables showing the ranking of 2023 within the 11 years 2013 to 2023 inclusive in terms of counts of earthquakes and energy output. |
|
|
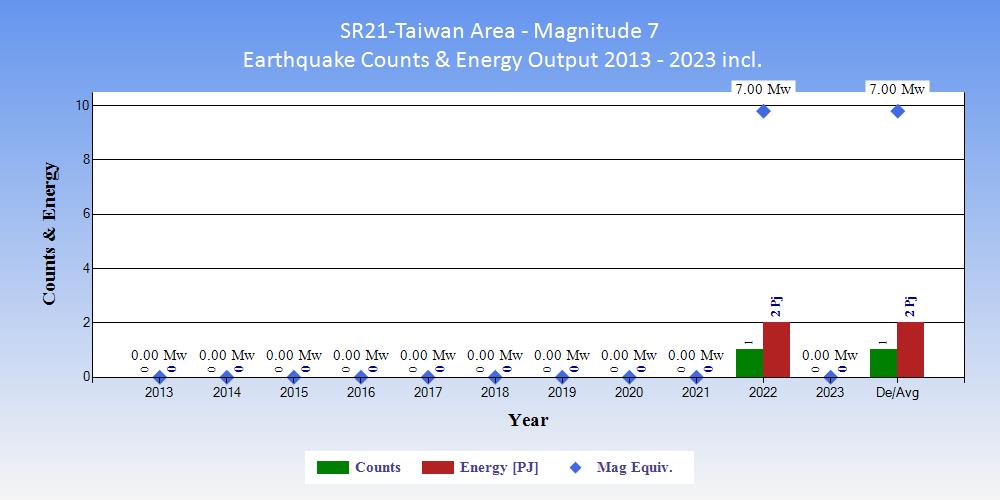
| Tables showing the ranking of 2023 within the 11 years 2013 to 2023 inclusive in terms of counts of earthquakes and energy output. |
|
|
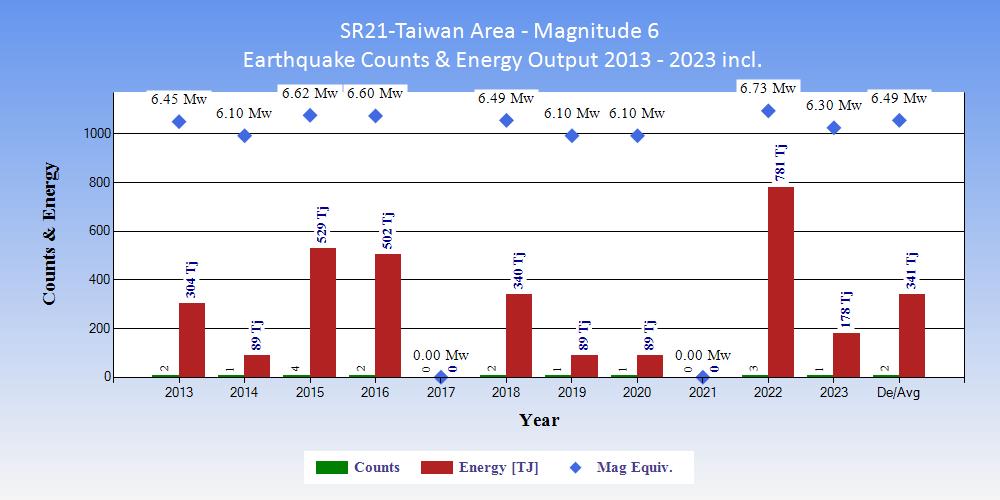
| Tables showing the ranking of 2023 within the 11 years 2013 to 2023 inclusive in terms of counts of earthquakes and energy output. |
|
|
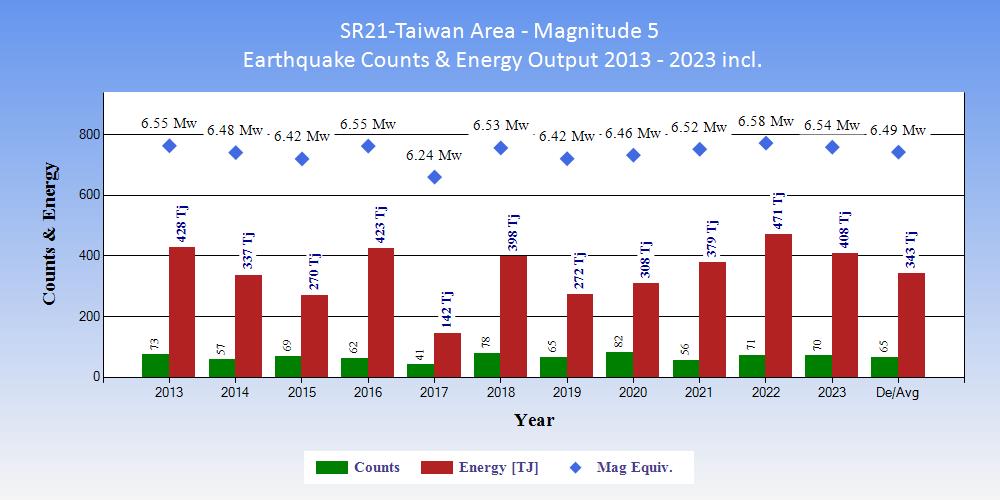
| Tables showing the ranking of 2023 within the 11 years 2013 to 2023 inclusive in terms of counts of earthquakes and energy output. |
|
|
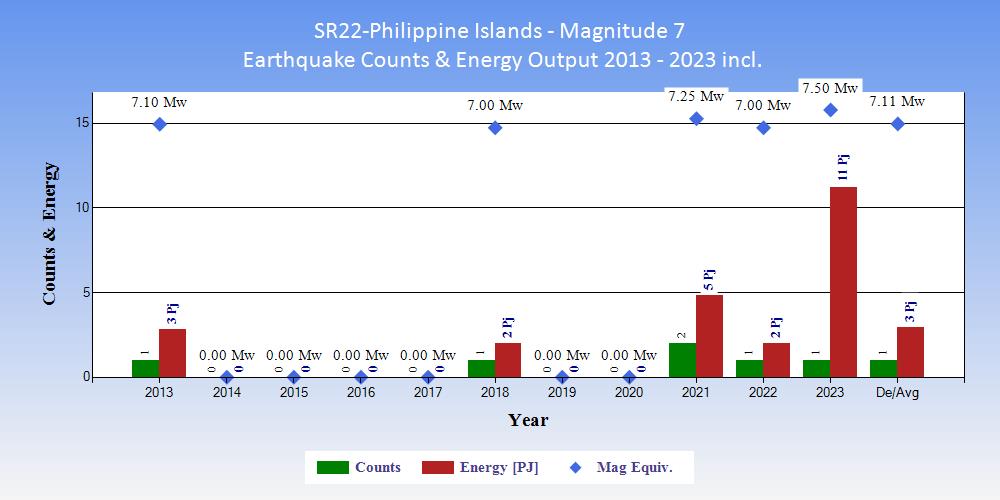
| Tables showing the ranking of 2023 within the 11 years 2013 to 2023 inclusive in terms of counts of earthquakes and energy output. |
|
|
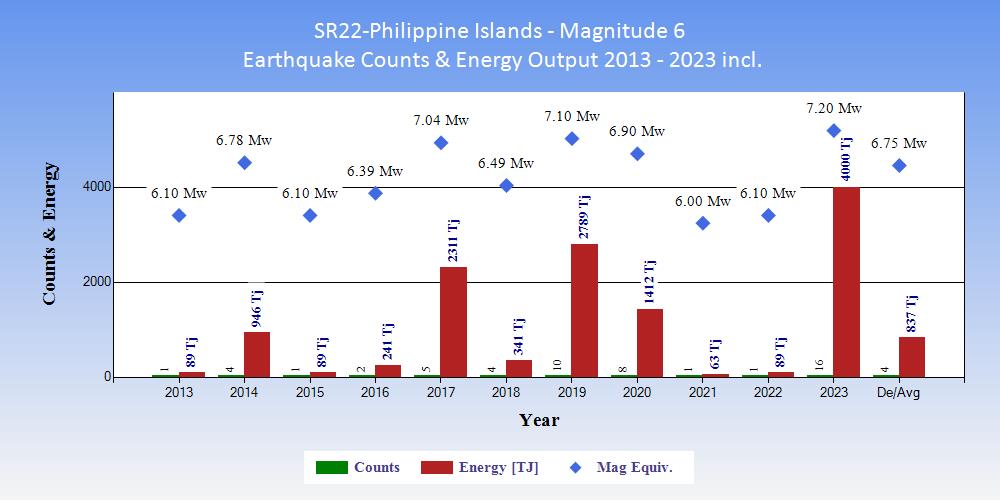
| Tables showing the ranking of 2023 within the 11 years 2013 to 2023 inclusive in terms of counts of earthquakes and energy output. |
|
|
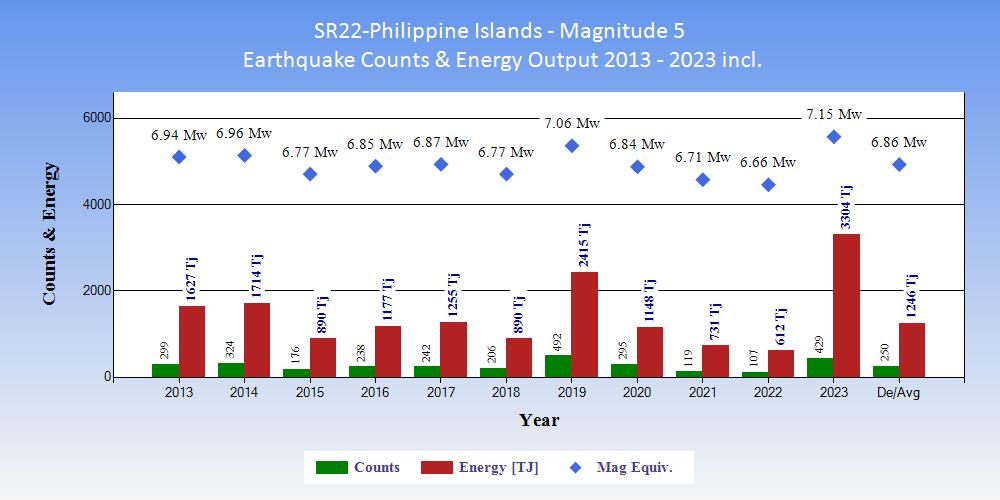
| Tables showing the ranking of 2023 within the 11 years 2013 to 2023 inclusive in terms of counts of earthquakes and energy output. |
|
|
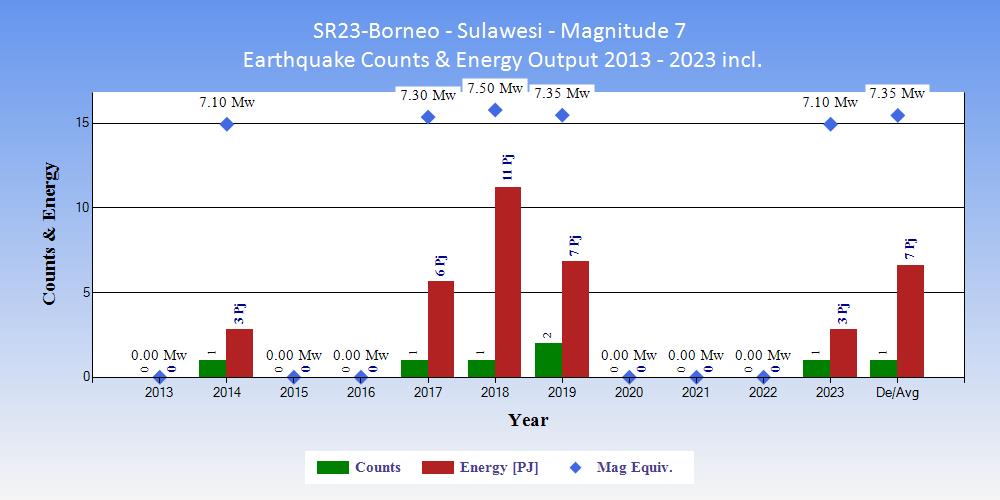
| Tables showing the ranking of 2023 within the 11 years 2013 to 2023 inclusive in terms of counts of earthquakes and energy output. |
|
|
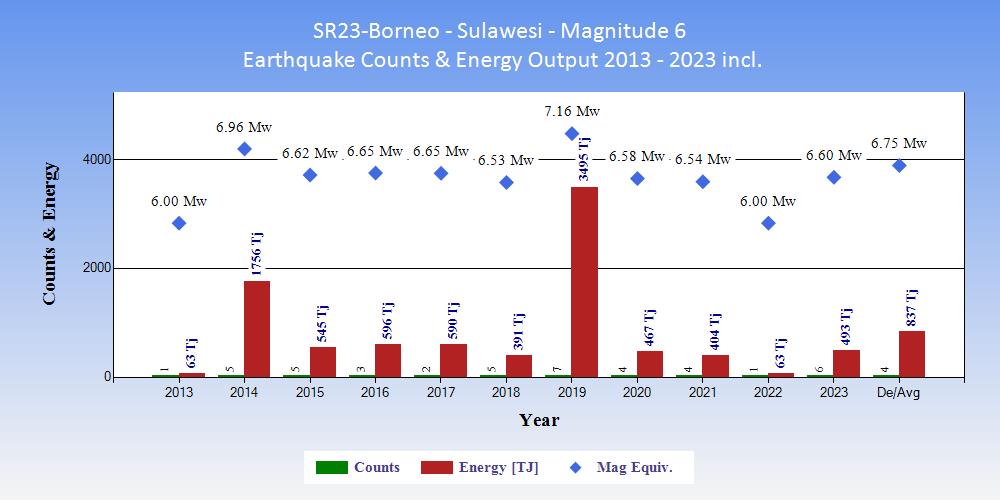
| Tables showing the ranking of 2023 within the 11 years 2013 to 2023 inclusive in terms of counts of earthquakes and energy output. |
|
|
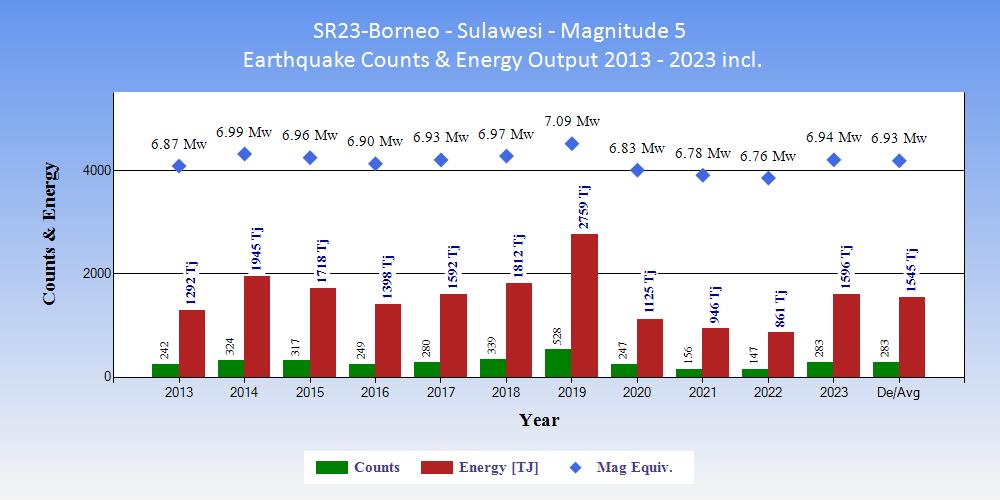
| Tables showing the ranking of 2023 within the 11 years 2013 to 2023 inclusive in terms of counts of earthquakes and energy output. |
|
|
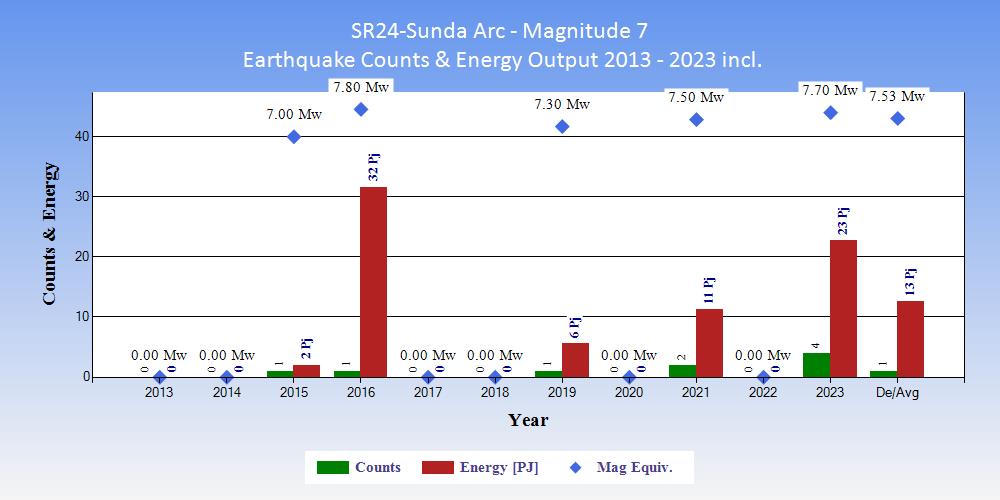
| Tables showing the ranking of 2023 within the 11 years 2013 to 2023 inclusive in terms of counts of earthquakes and energy output. |
|
|
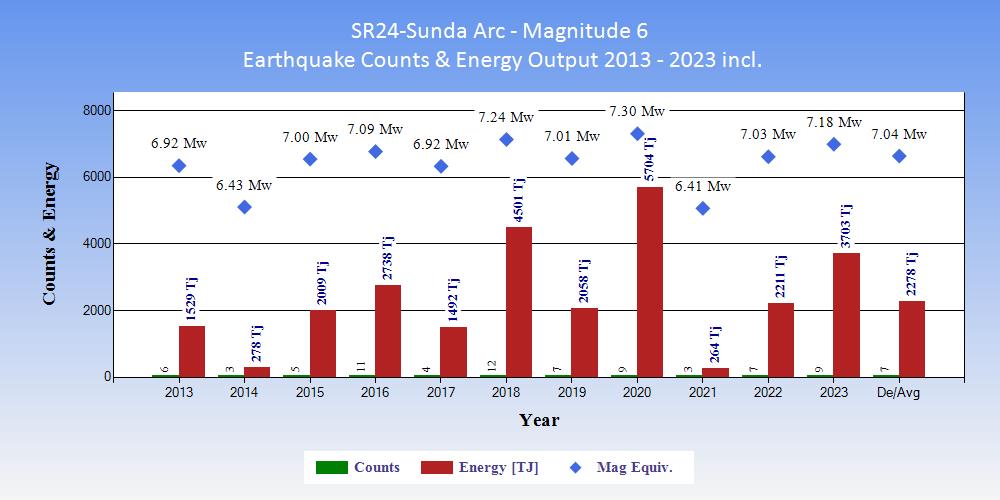
| Tables showing the ranking of 2023 within the 11 years 2013 to 2023 inclusive in terms of counts of earthquakes and energy output. |
|
|
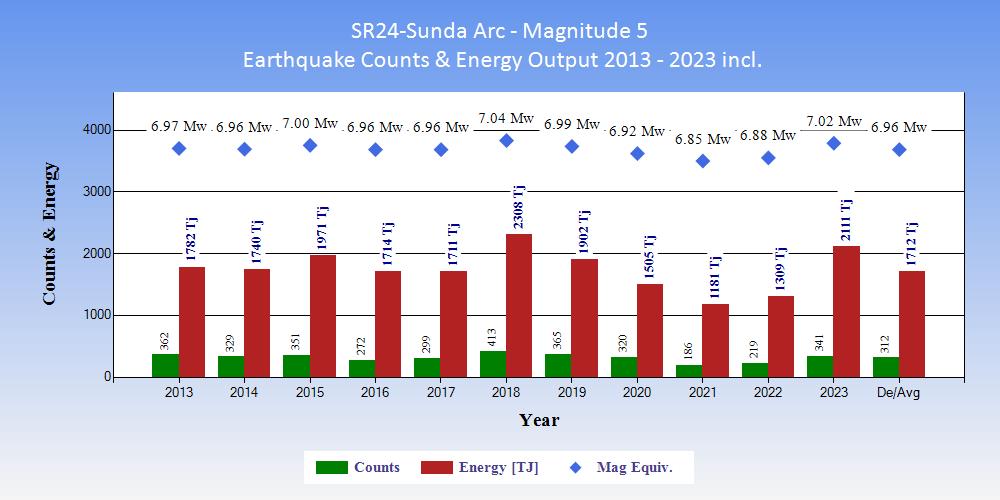
| Tables showing the ranking of 2023 within the 11 years 2013 to 2023 inclusive in terms of counts of earthquakes and energy output. |
|
|
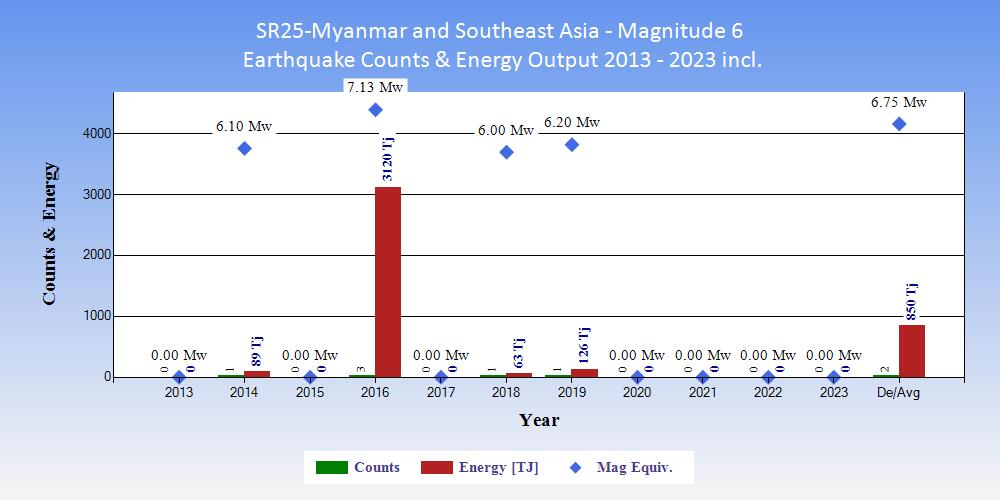
| Tables showing the ranking of 2023 within the 11 years 2013 to 2023 inclusive in terms of counts of earthquakes and energy output. |
|
|
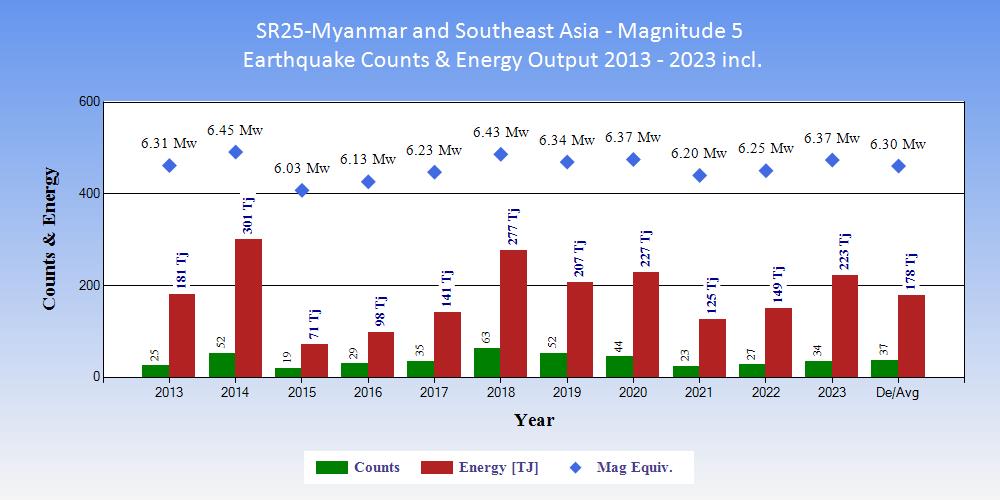
| Tables showing the ranking of 2023 within the 11 years 2013 to 2023 inclusive in terms of counts of earthquakes and energy output. |
|
|
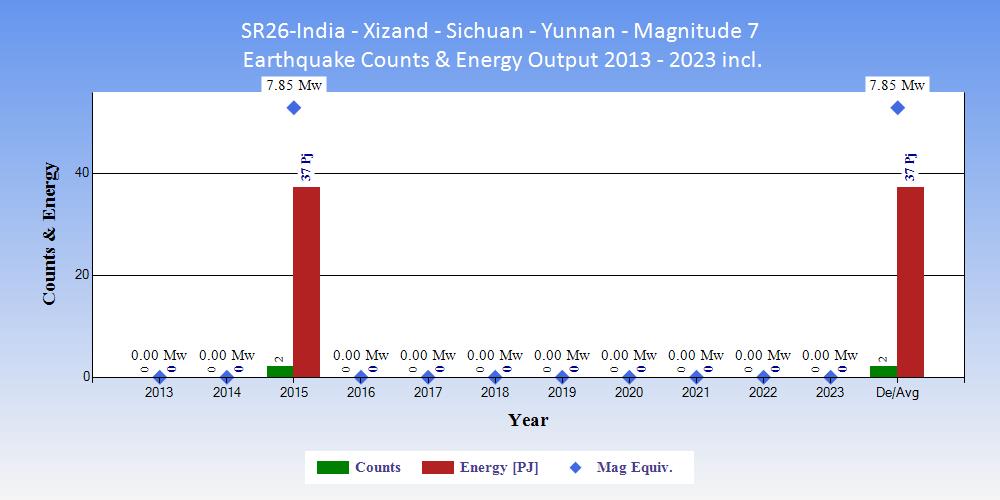
| Tables showing the ranking of 2023 within the 11 years 2013 to 2023 inclusive in terms of counts of earthquakes and energy output. |
|
|
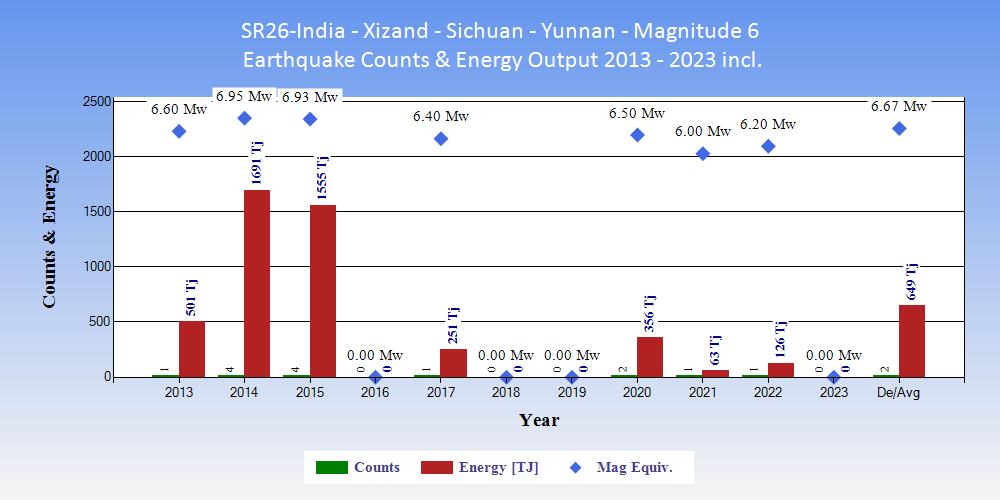
| Tables showing the ranking of 2023 within the 11 years 2013 to 2023 inclusive in terms of counts of earthquakes and energy output. |
|
|
| Tables showing the ranking of 2023 within the 11 years 2013 to 2023 inclusive in terms of counts of earthquakes and energy output. |
|
|
| Tables showing the ranking of 2023 within the 11 years 2013 to 2023 inclusive in terms of counts of earthquakes and energy output. |
|
|
| Tables showing the ranking of 2023 within the 11 years 2013 to 2023 inclusive in terms of counts of earthquakes and energy output. |
|
|
| Tables showing the ranking of 2023 within the 11 years 2013 to 2023 inclusive in terms of counts of earthquakes and energy output. |
|
|
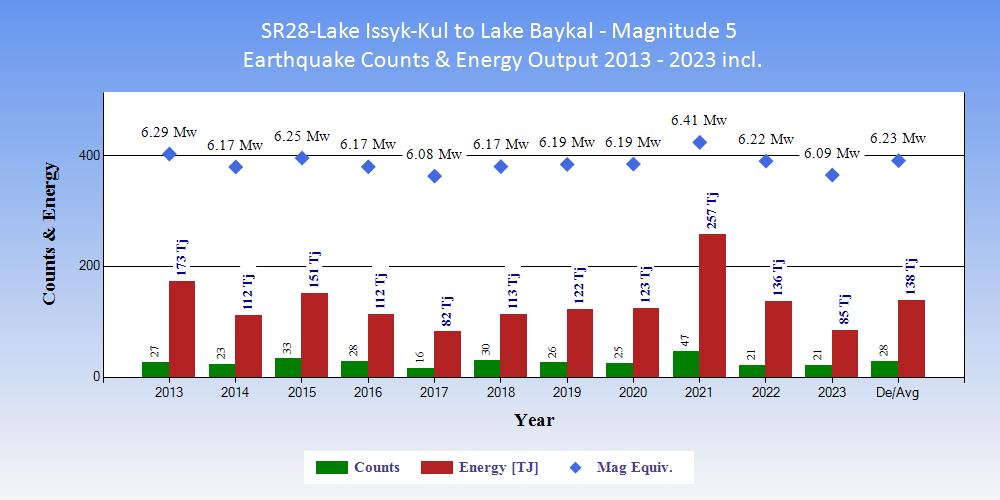
| Tables showing the ranking of 2023 within the 11 years 2013 to 2023 inclusive in terms of counts of earthquakes and energy output. |
|
|
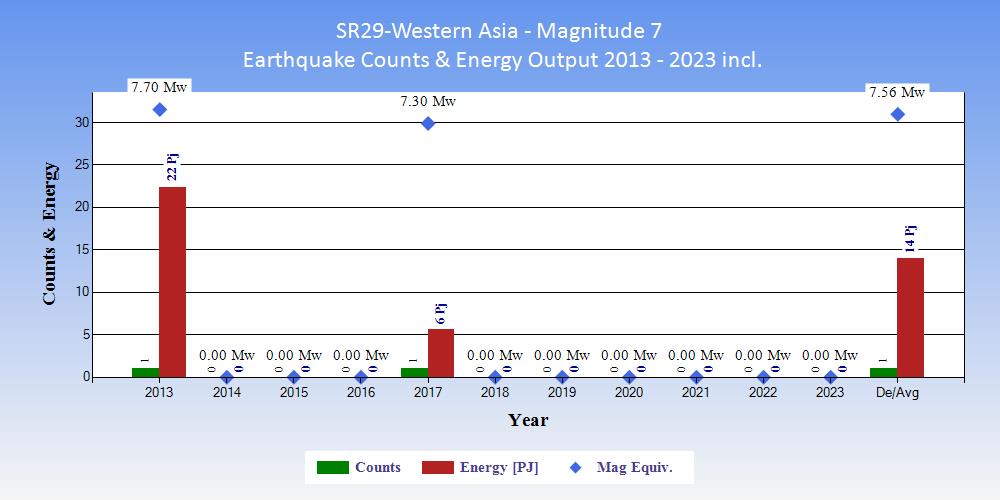
| Tables showing the ranking of 2023 within the 11 years 2013 to 2023 inclusive in terms of counts of earthquakes and energy output. |
|
|
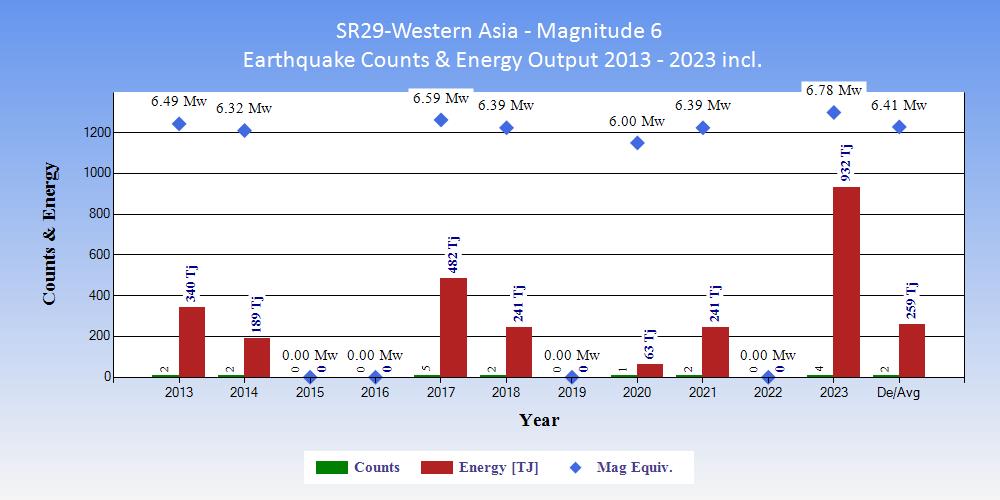
| Tables showing the ranking of 2023 within the 11 years 2013 to 2023 inclusive in terms of counts of earthquakes and energy output. |
|
|
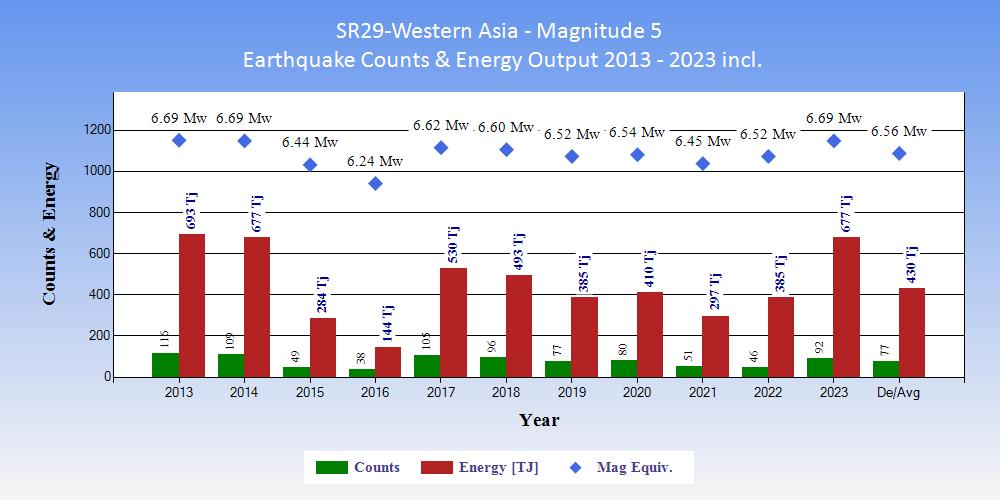
| Tables showing the ranking of 2023 within the 11 years 2013 to 2023 inclusive in terms of counts of earthquakes and energy output. |
|
|
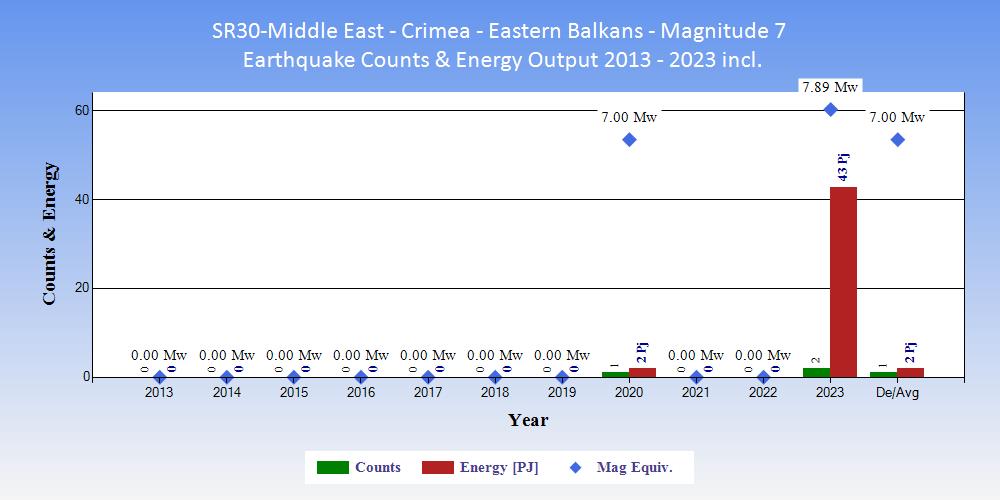
| Tables showing the ranking of 2023 within the 11 years 2013 to 2023 inclusive in terms of counts of earthquakes and energy output. |
|
|
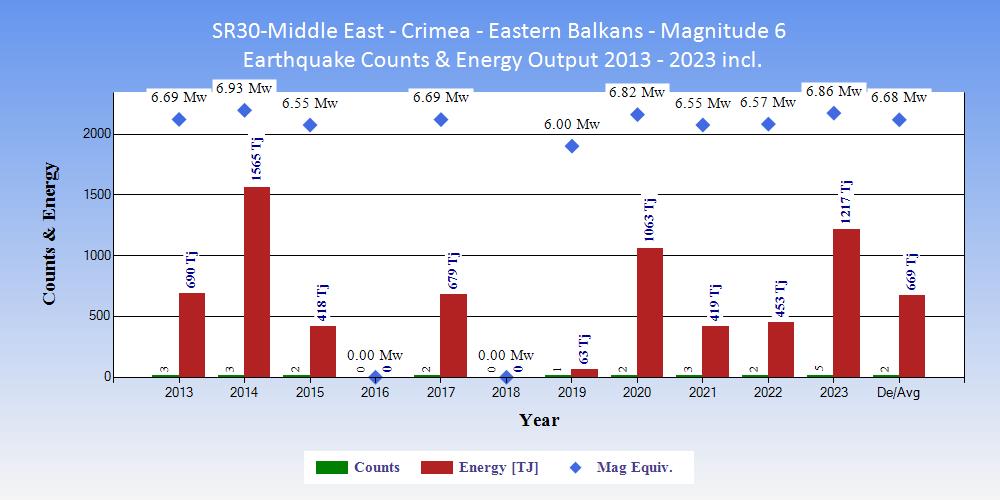
| Tables showing the ranking of 2023 within the 11 years 2013 to 2023 inclusive in terms of counts of earthquakes and energy output. |
|
|
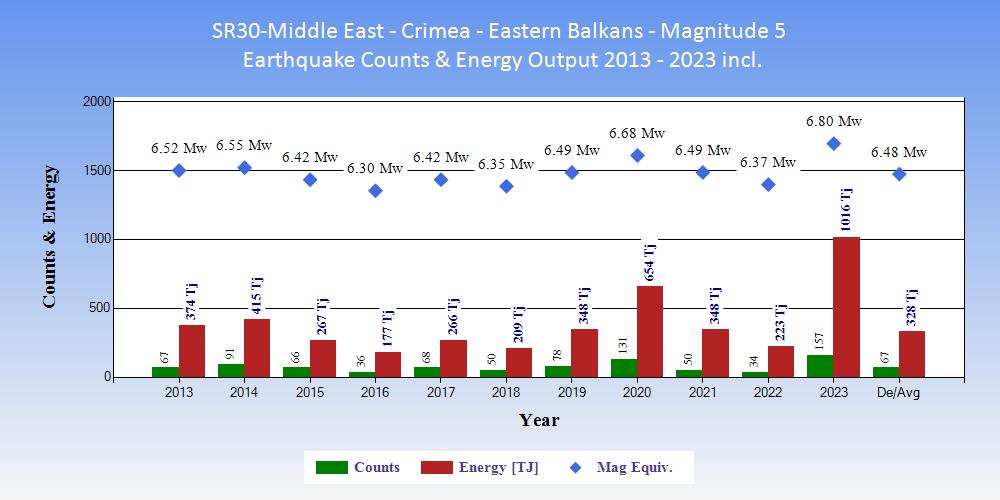
| Tables showing the ranking of 2023 within the 11 years 2013 to 2023 inclusive in terms of counts of earthquakes and energy output. |
|
|
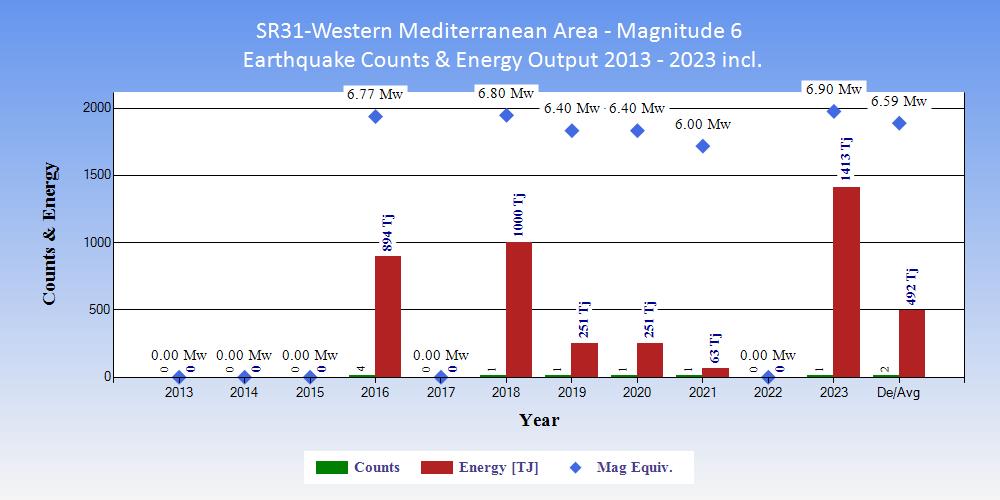
| Tables showing the ranking of 2023 within the 11 years 2013 to 2023 inclusive in terms of counts of earthquakes and energy output. |
|
|
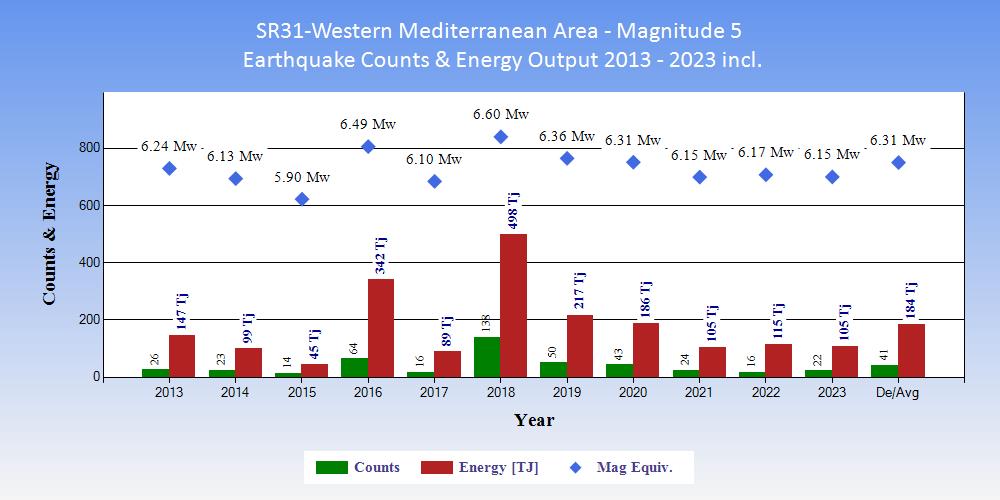
| Tables showing the ranking of 2023 within the 11 years 2013 to 2023 inclusive in terms of counts of earthquakes and energy output. |
|
|
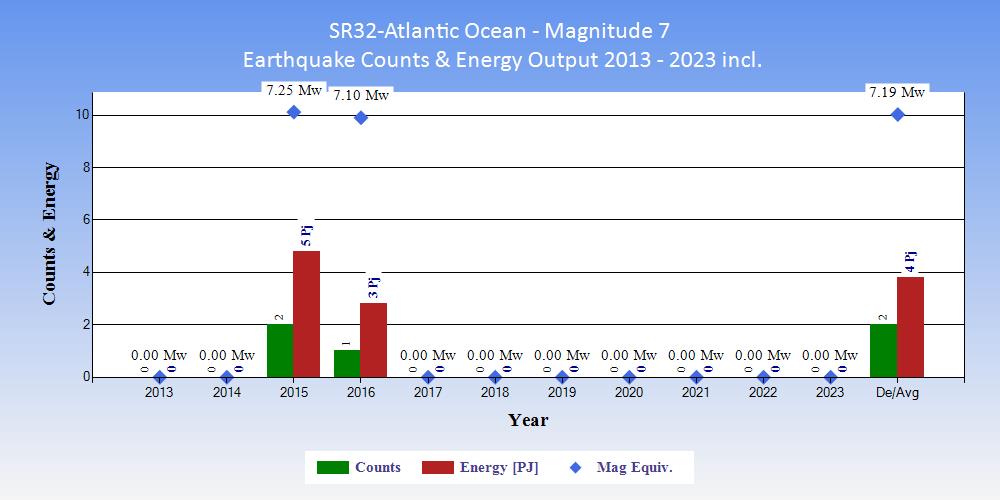
| Tables showing the ranking of 2023 within the 11 years 2013 to 2023 inclusive in terms of counts of earthquakes and energy output. |
|
|
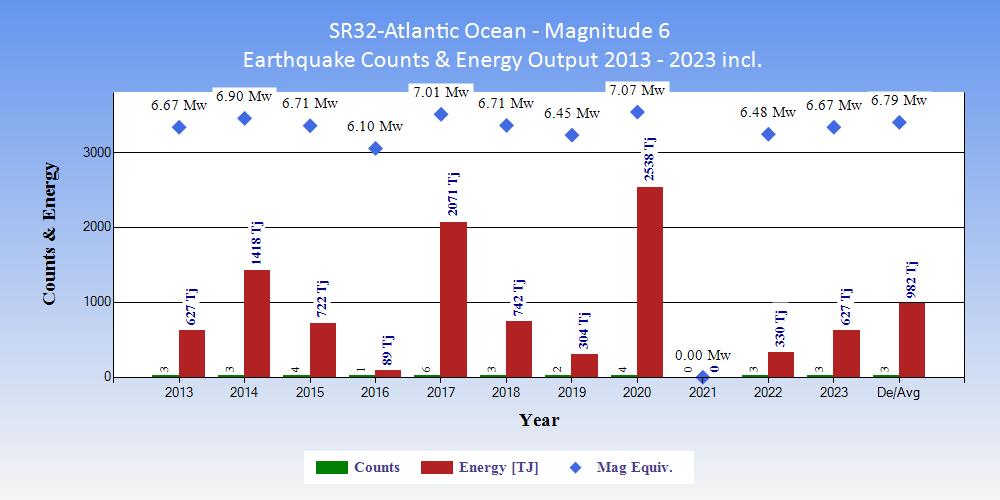
| Tables showing the ranking of 2023 within the 11 years 2013 to 2023 inclusive in terms of counts of earthquakes and energy output. |
|
|
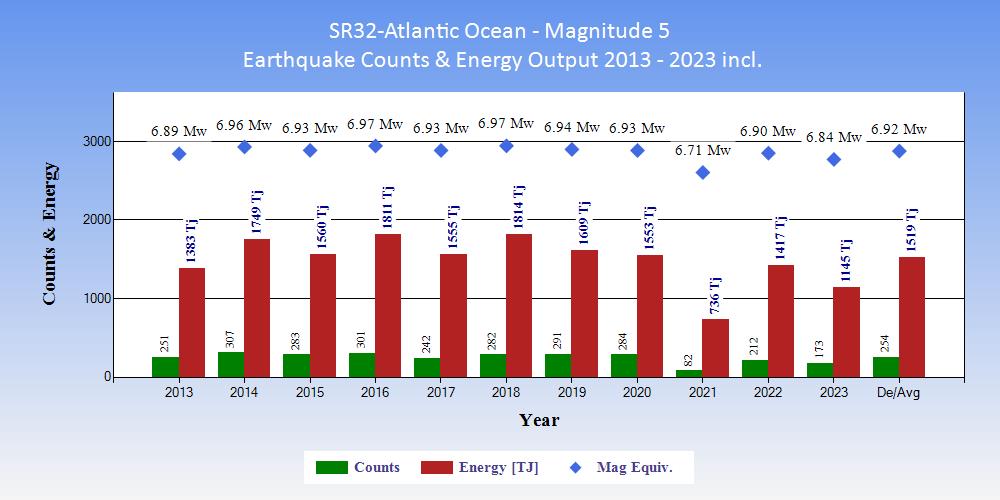
| Tables showing the ranking of 2023 within the 11 years 2013 to 2023 inclusive in terms of counts of earthquakes and energy output. |
|
|
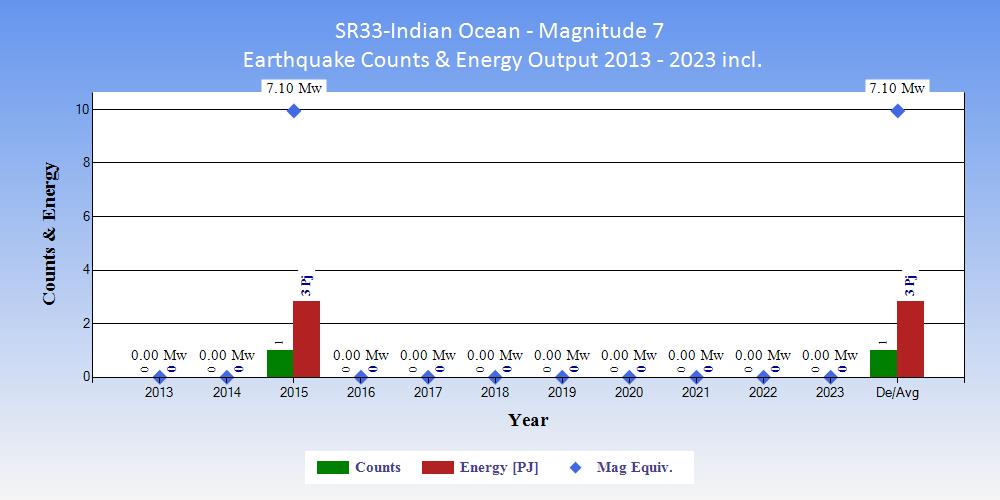
| Tables showing the ranking of 2023 within the 11 years 2013 to 2023 inclusive in terms of counts of earthquakes and energy output. |
|
|
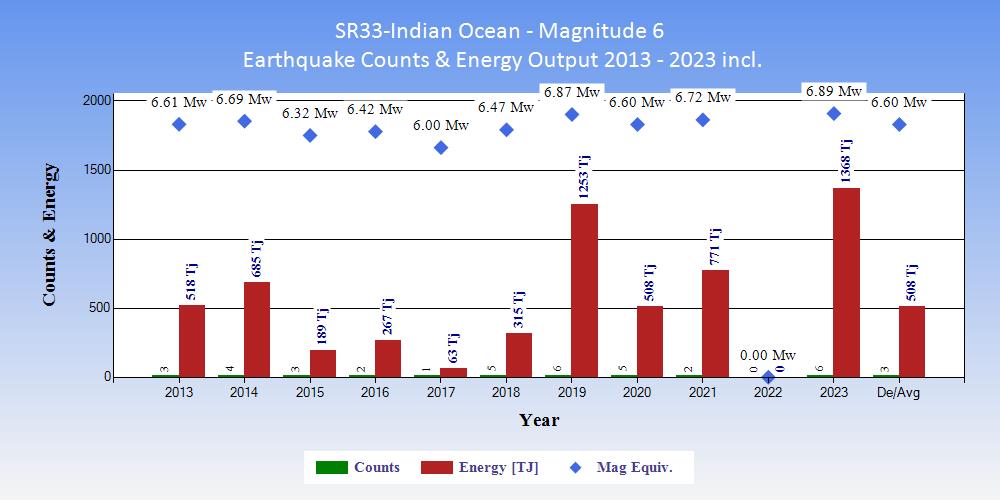
| Tables showing the ranking of 2023 within the 11 years 2013 to 2023 inclusive in terms of counts of earthquakes and energy output. |
|
|
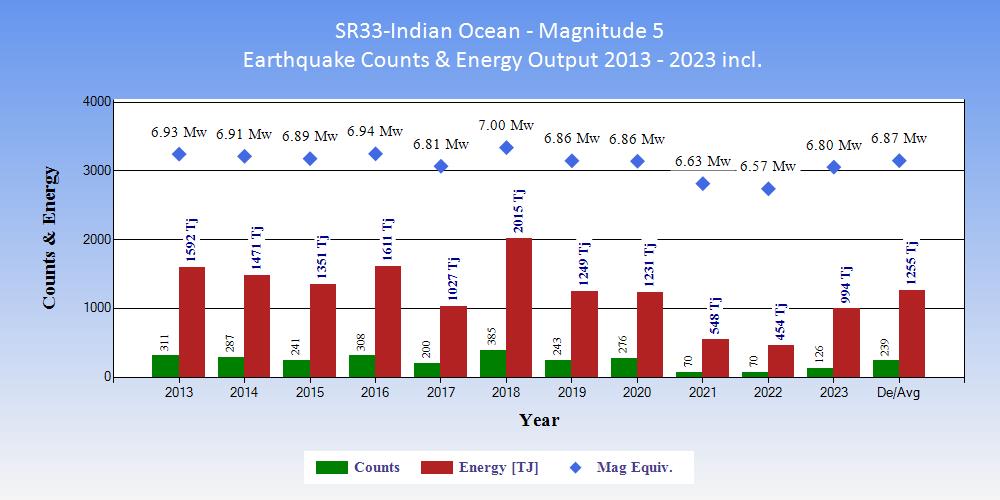
| Tables showing the ranking of 2023 within the 11 years 2013 to 2023 inclusive in terms of counts of earthquakes and energy output. |
|
|
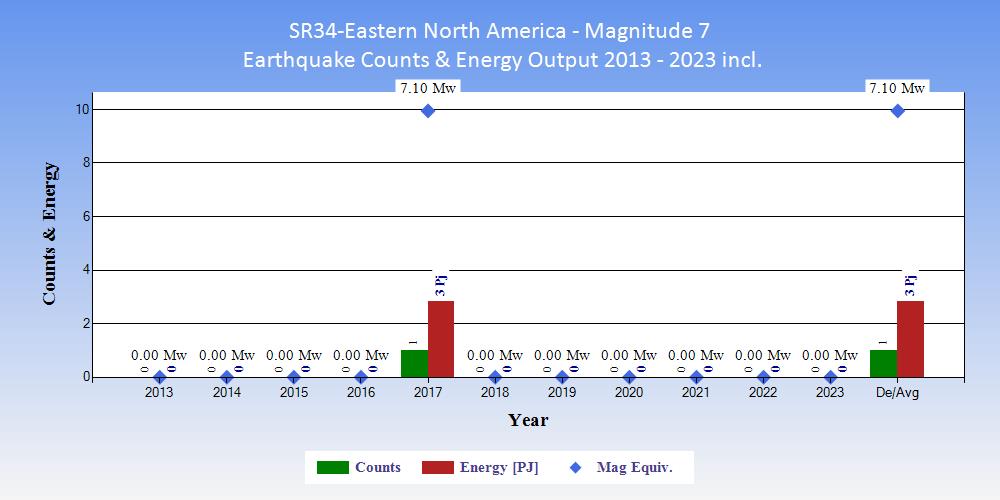
| Tables showing the ranking of 2023 within the 11 years 2013 to 2023 inclusive in terms of counts of earthquakes and energy output. |
|
|
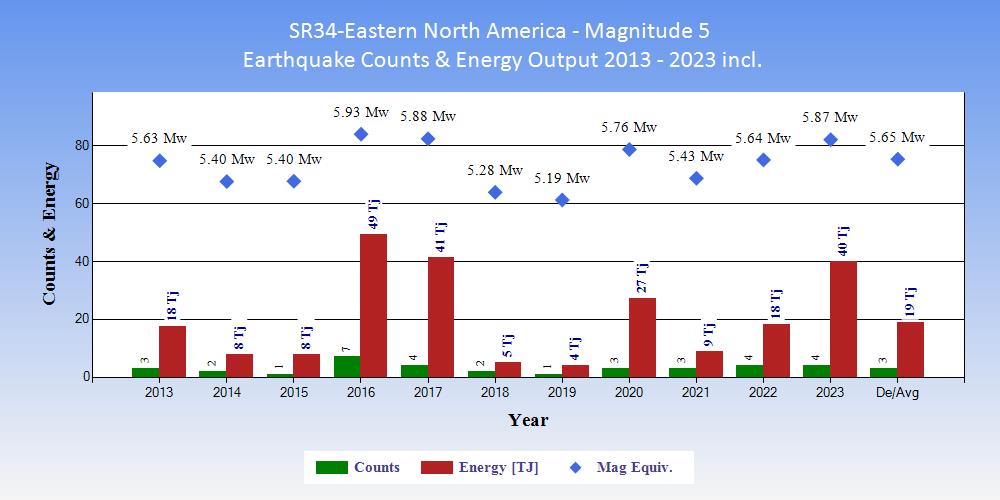
| Tables showing the ranking of 2023 within the 11 years 2013 to 2023 inclusive in terms of counts of earthquakes and energy output. |
|
|
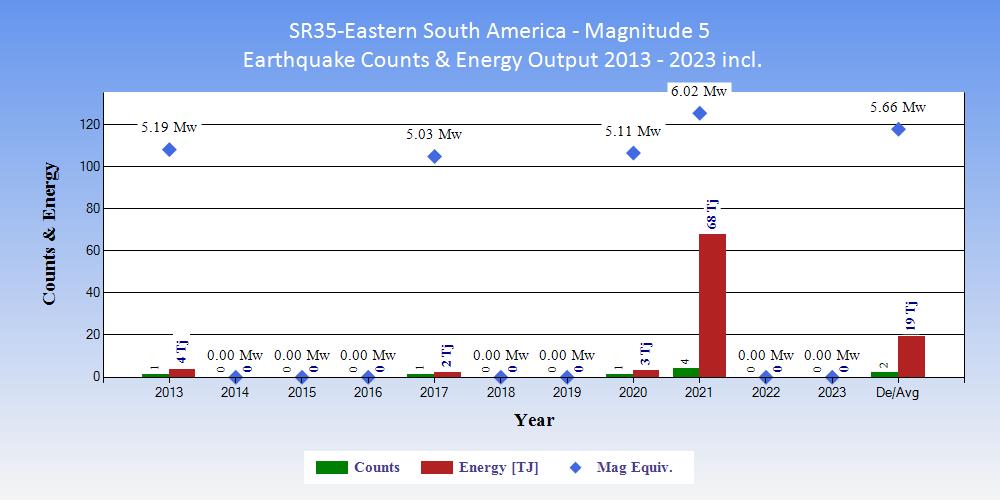
| Tables showing the ranking of 2023 within the 11 years 2013 to 2023 inclusive in terms of counts of earthquakes and energy output. |
|
|
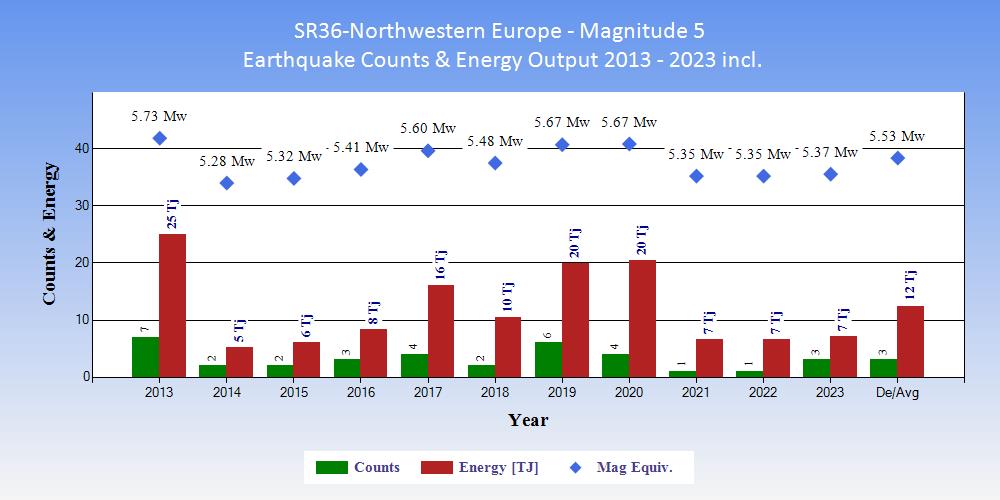
| Tables showing the ranking of 2023 within the 11 years 2013 to 2023 inclusive in terms of counts of earthquakes and energy output. |
|
|
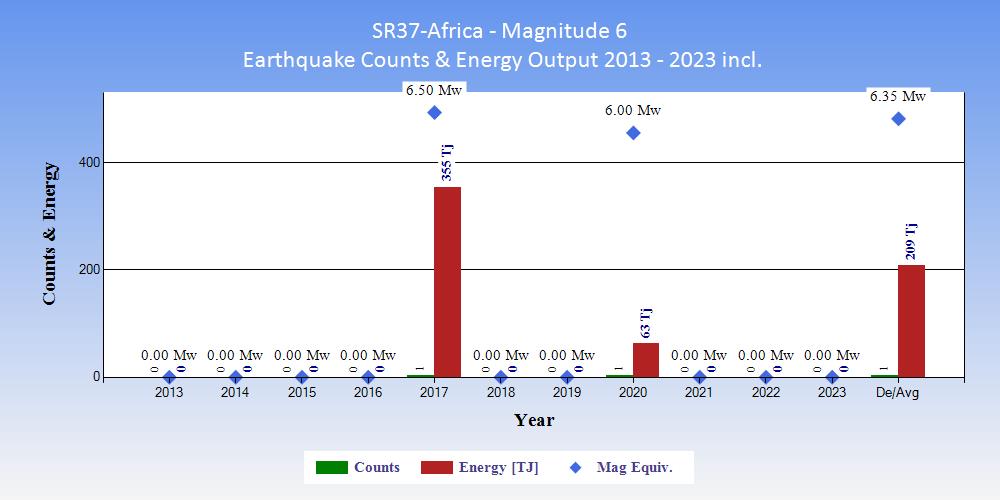
| Tables showing the ranking of 2023 within the 11 years 2013 to 2023 inclusive in terms of counts of earthquakes and energy output. |
|
|
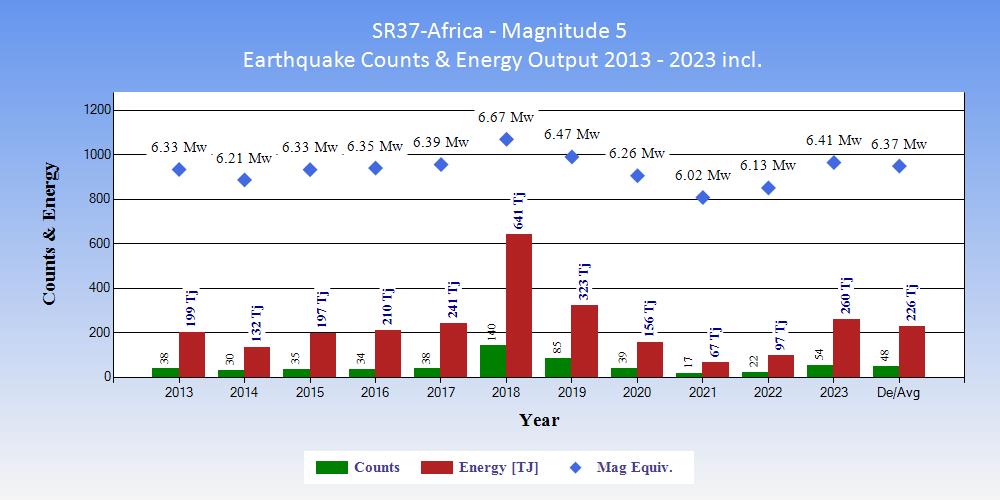
| Tables showing the ranking of 2023 within the 11 years 2013 to 2023 inclusive in terms of counts of earthquakes and energy output. |
|
|
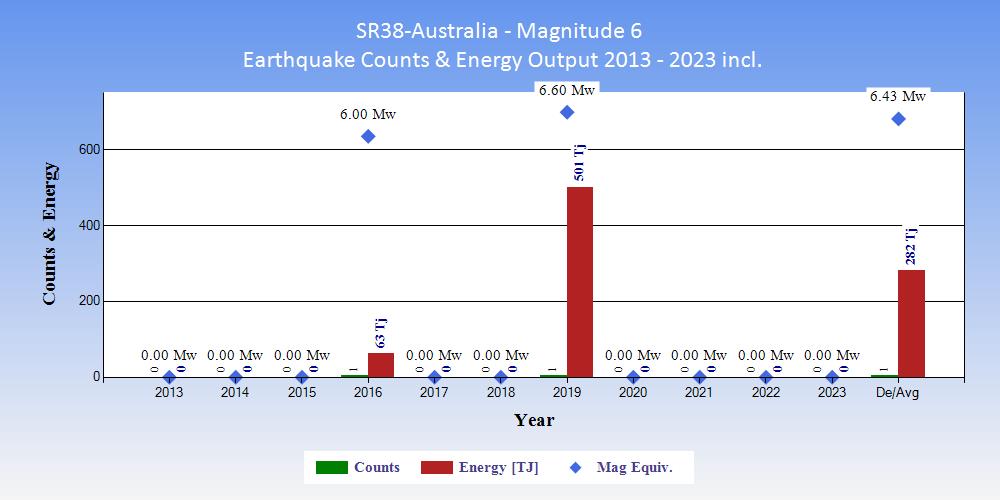
| Tables showing the ranking of 2023 within the 11 years 2013 to 2023 inclusive in terms of counts of earthquakes and energy output. |
|
|
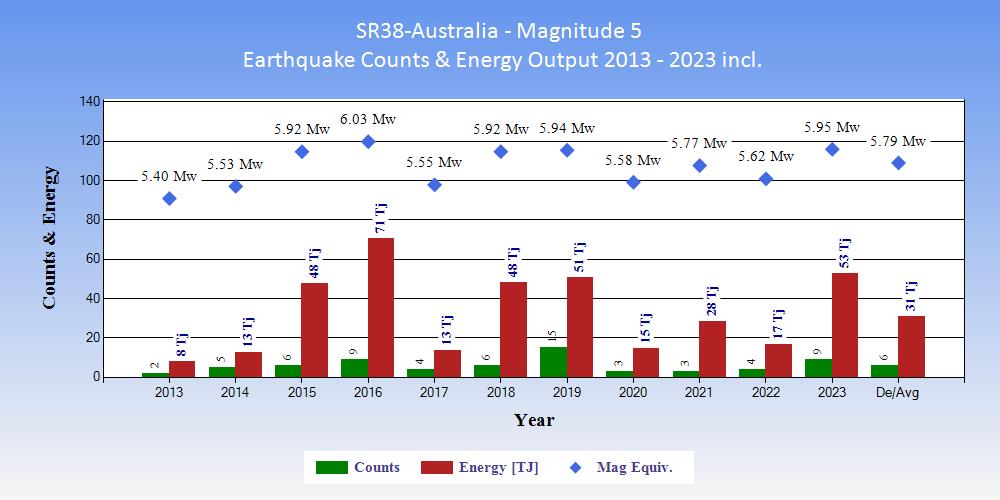
| Tables showing the ranking of 2023 within the 11 years 2013 to 2023 inclusive in terms of counts of earthquakes and energy output. |
|
|
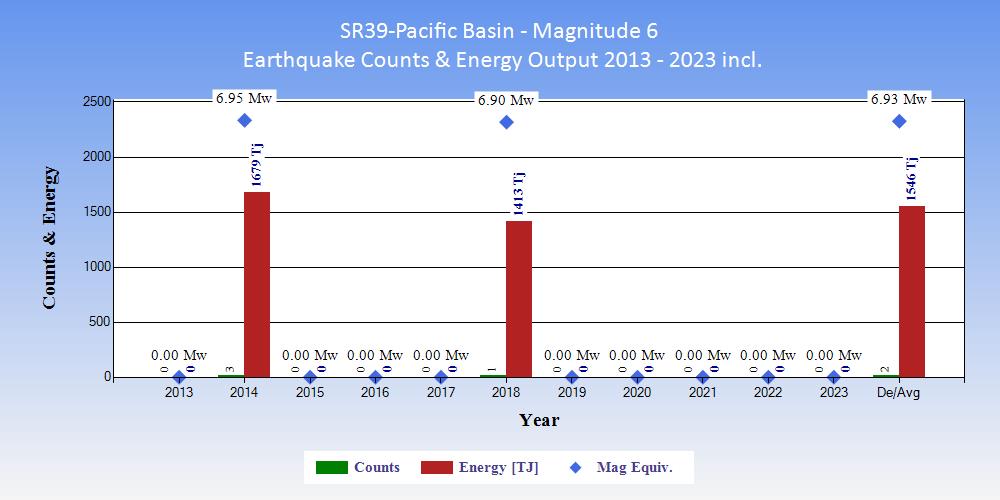
| Tables showing the ranking of 2023 within the 11 years 2013 to 2023 inclusive in terms of counts of earthquakes and energy output. |
|
|
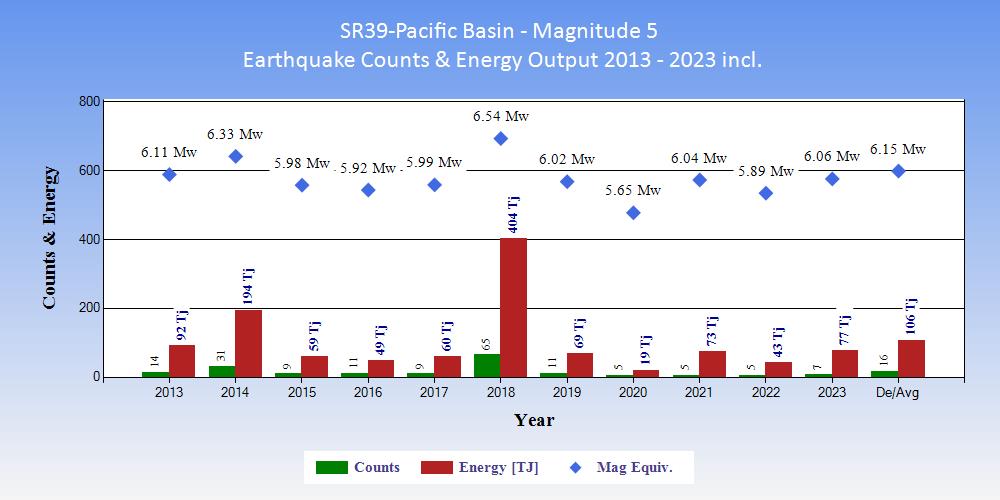
| Tables showing the ranking of 2023 within the 11 years 2013 to 2023 inclusive in terms of counts of earthquakes and energy output. |
|
|
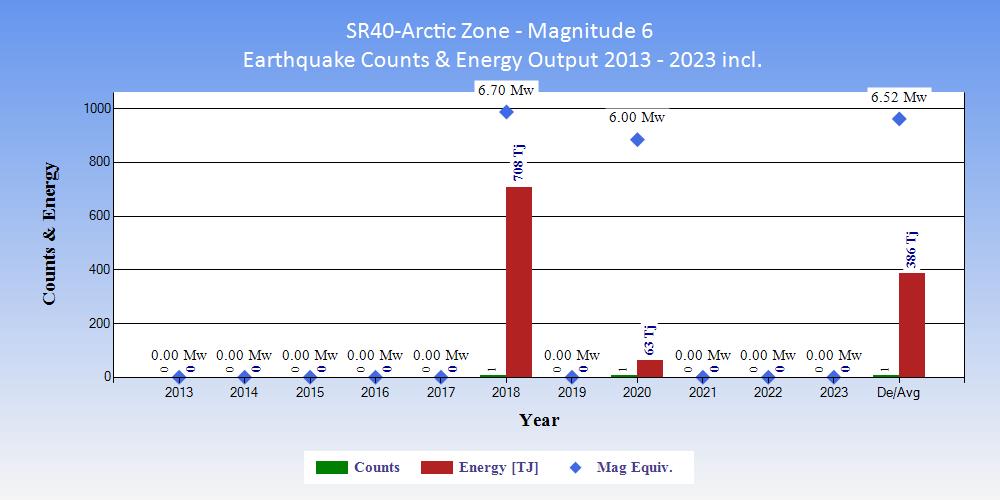
| Tables showing the ranking of 2023 within the 11 years 2013 to 2023 inclusive in terms of counts of earthquakes and energy output. |
|
|
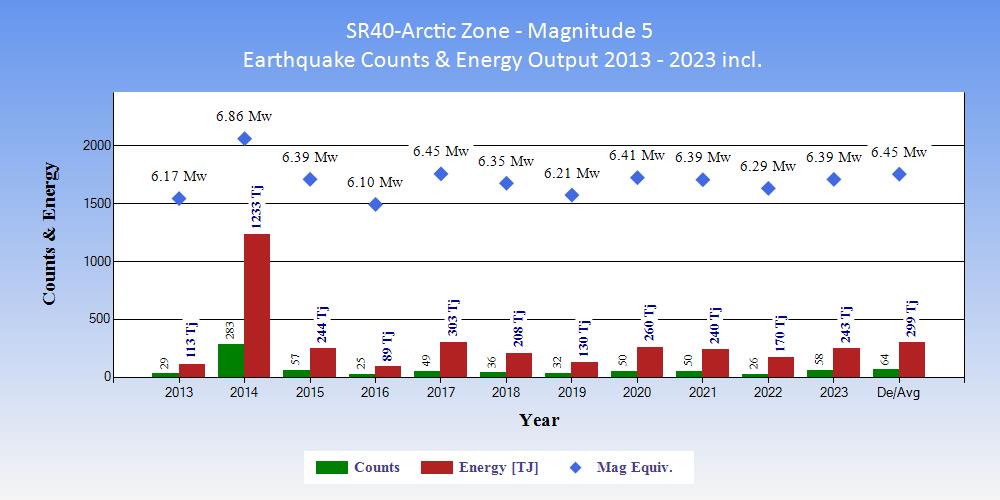
| Tables showing the ranking of 2023 within the 11 years 2013 to 2023 inclusive in terms of counts of earthquakes and energy output. |
|
|
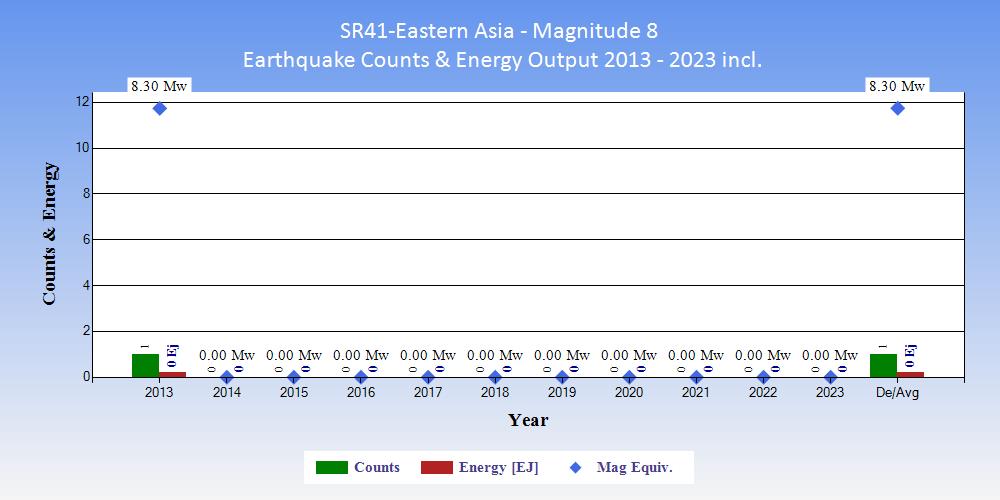
| Tables showing the ranking of 2023 within the 11 years 2013 to 2023 inclusive in terms of counts of earthquakes and energy output. |
|
|
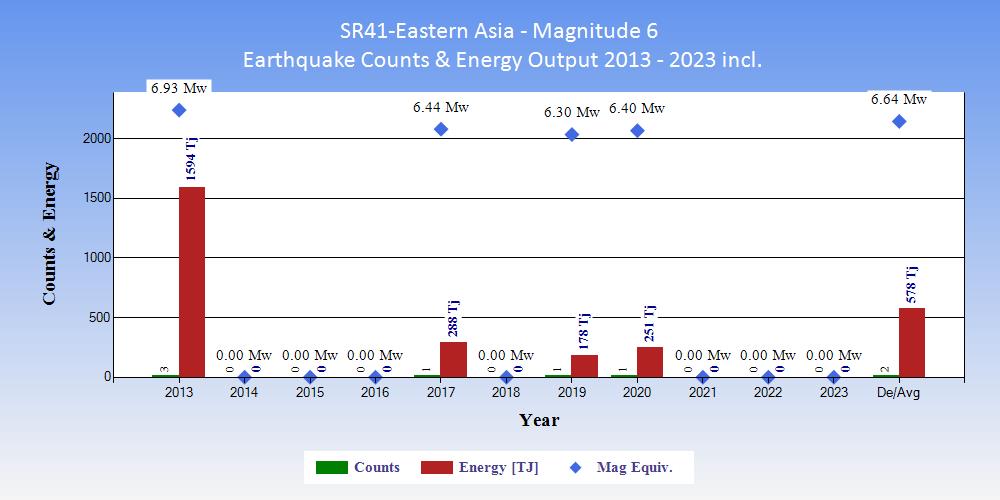
| Tables showing the ranking of 2023 within the 11 years 2013 to 2023 inclusive in terms of counts of earthquakes and energy output. |
|
|
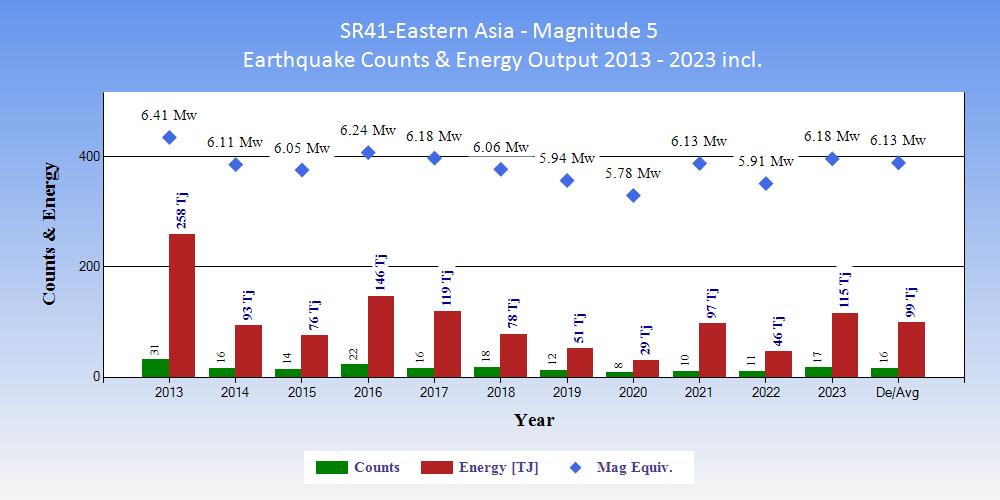
| Tables showing the ranking of 2023 within the 11 years 2013 to 2023 inclusive in terms of counts of earthquakes and energy output. |
|
|
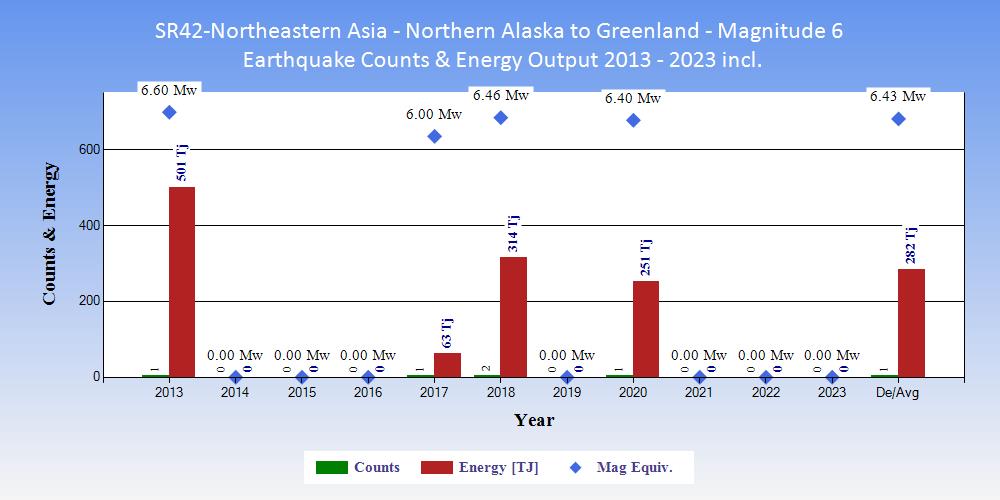
| Tables showing the ranking of 2023 within the 11 years 2013 to 2023 inclusive in terms of counts of earthquakes and energy output. |
|
|
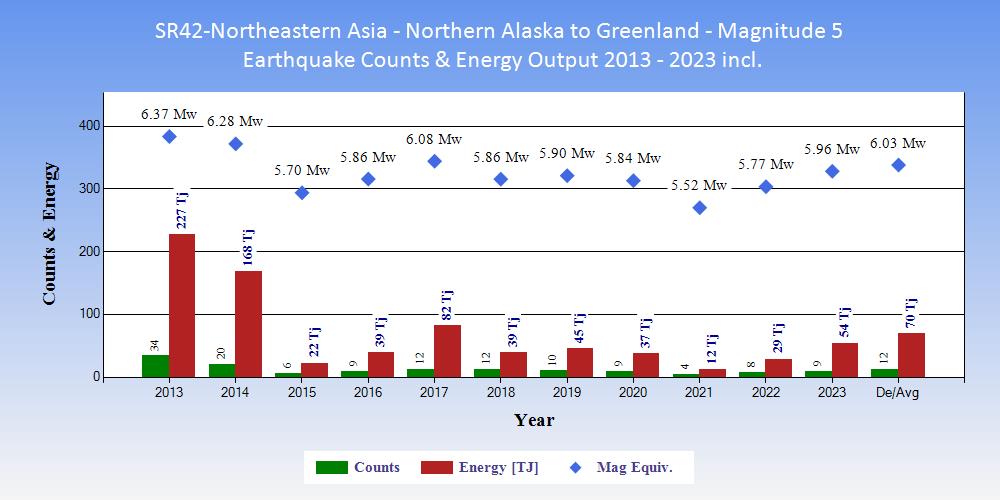
| Tables showing the ranking of 2023 within the 11 years 2013 to 2023 inclusive in terms of counts of earthquakes and energy output. |
|
|
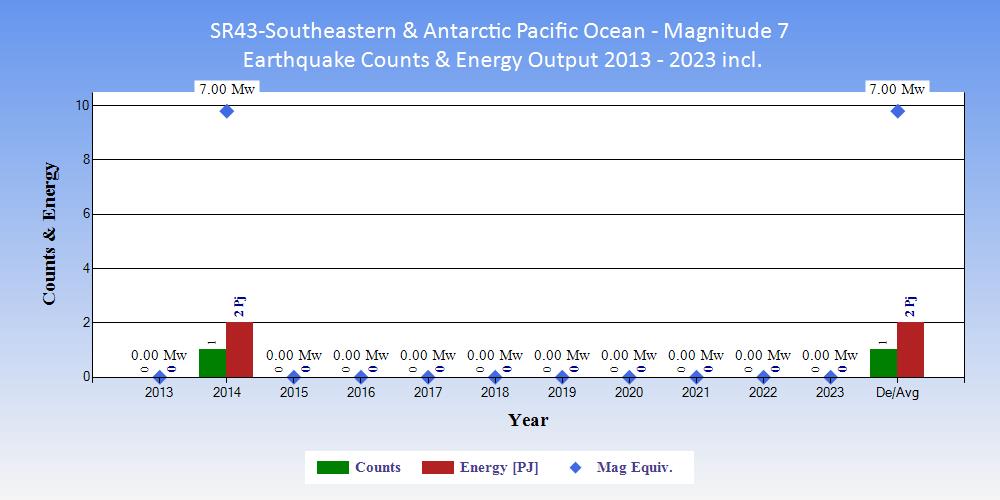
| Tables showing the ranking of 2023 within the 11 years 2013 to 2023 inclusive in terms of counts of earthquakes and energy output. |
|
|
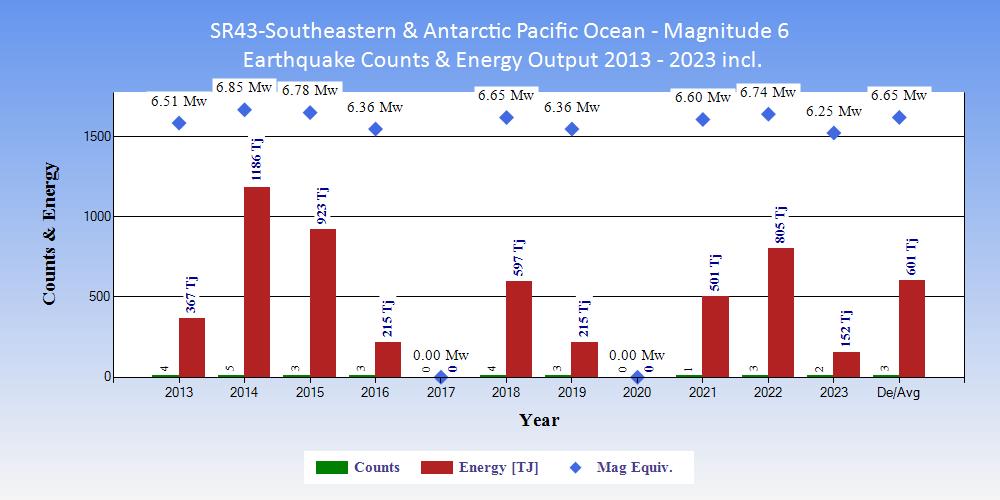
| Tables showing the ranking of 2023 within the 11 years 2013 to 2023 inclusive in terms of counts of earthquakes and energy output. |
|
|
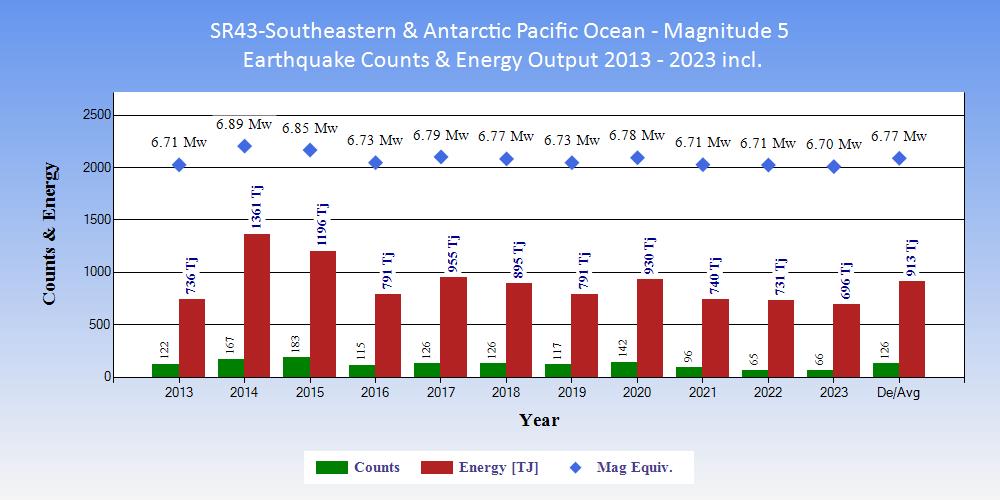
| Tables showing the ranking of 2023 within the 11 years 2013 to 2023 inclusive in terms of counts of earthquakes and energy output. |
|
|
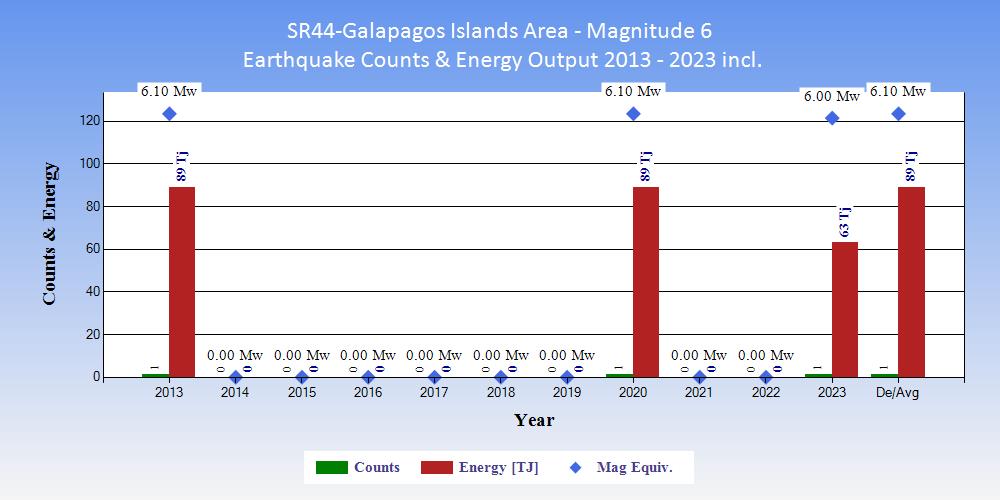
| Tables showing the ranking of 2023 within the 11 years 2013 to 2023 inclusive in terms of counts of earthquakes and energy output. |
|
|
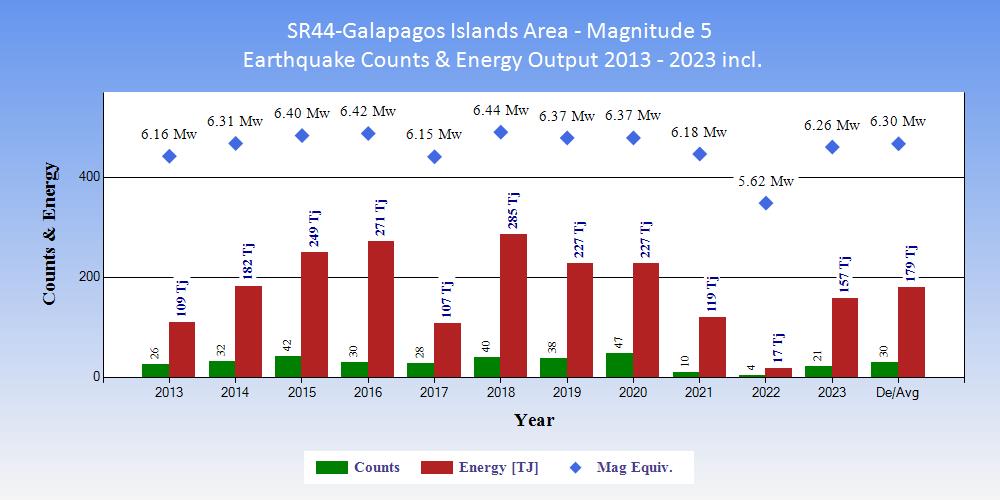
| Tables showing the ranking of 2023 within the 11 years 2013 to 2023 inclusive in terms of counts of earthquakes and energy output. |
|
|
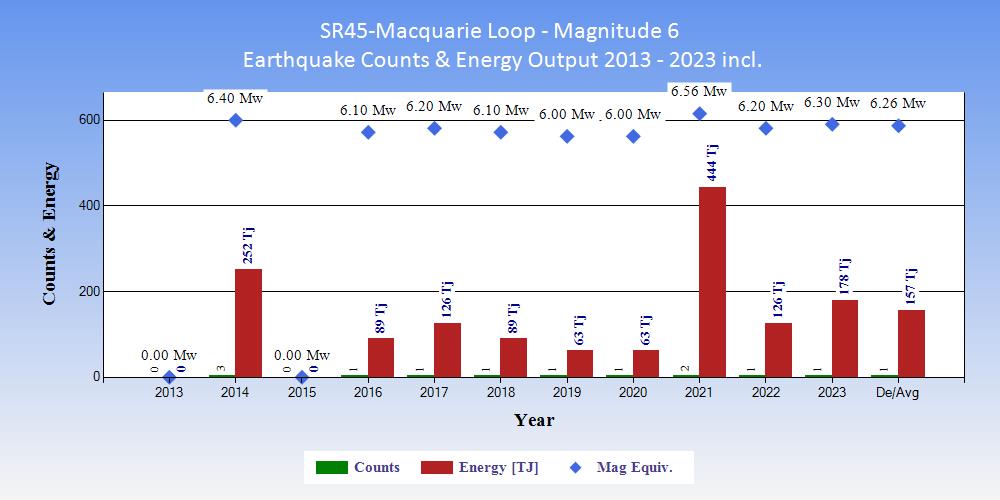
| Tables showing the ranking of 2023 within the 11 years 2013 to 2023 inclusive in terms of counts of earthquakes and energy output. |
|
|
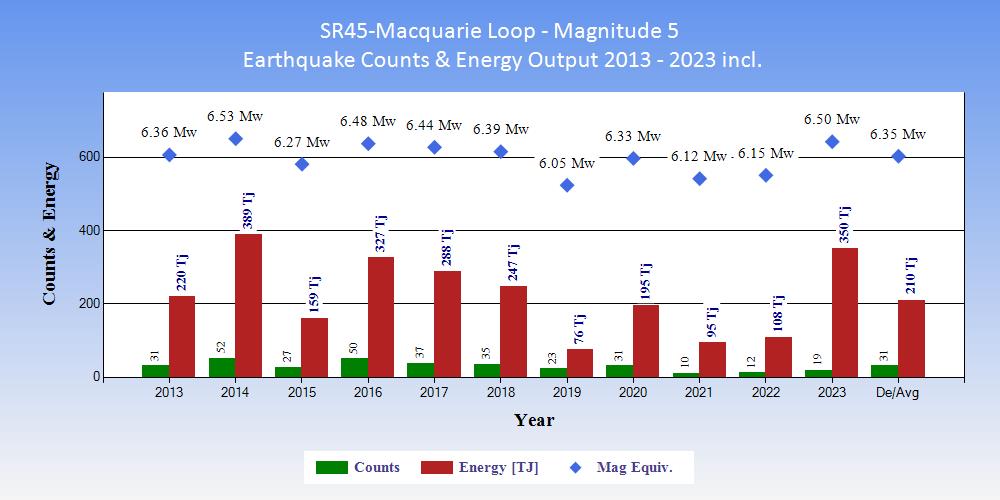
| Tables showing the ranking of 2023 within the 11 years 2013 to 2023 inclusive in terms of counts of earthquakes and energy output. |
|
|
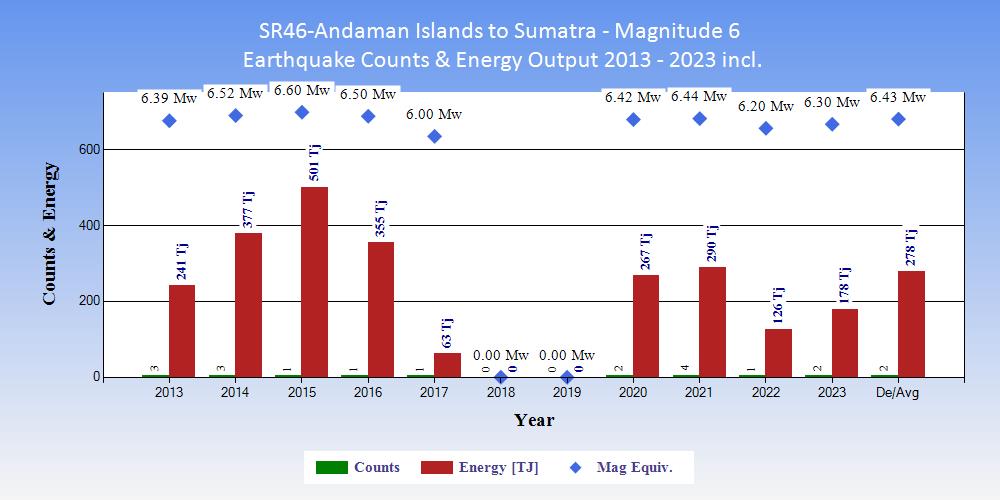
| Tables showing the ranking of 2023 within the 11 years 2013 to 2023 inclusive in terms of counts of earthquakes and energy output. |
|
|
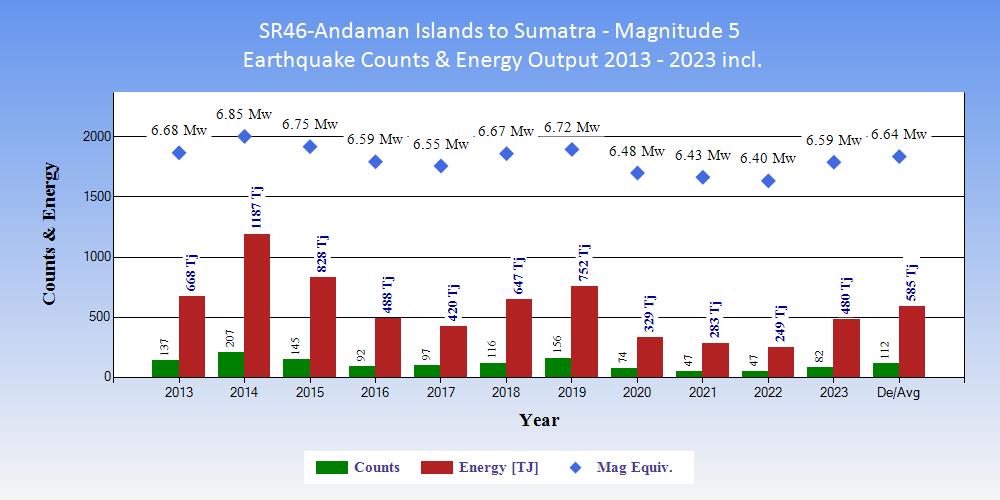
| Tables showing the ranking of 2023 within the 11 years 2013 to 2023 inclusive in terms of counts of earthquakes and energy output. |
|
|
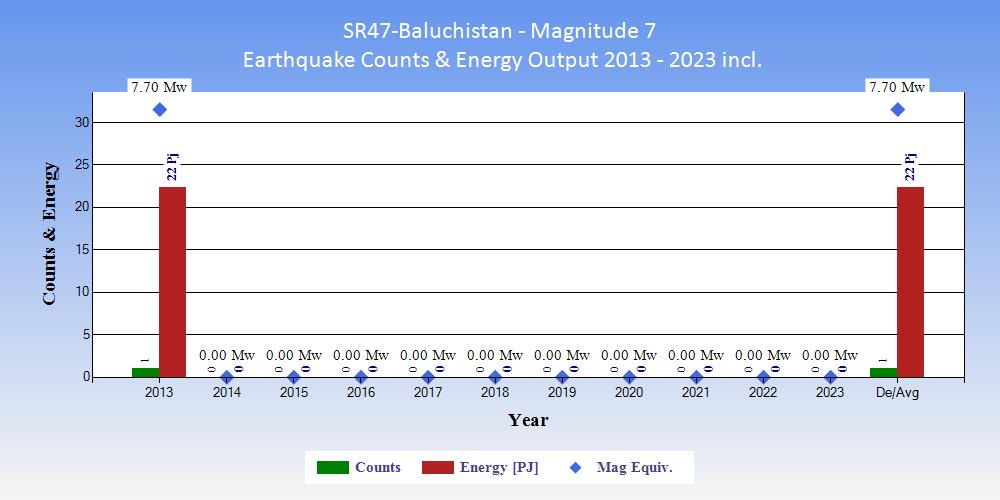
| Tables showing the ranking of 2023 within the 11 years 2013 to 2023 inclusive in terms of counts of earthquakes and energy output. |
|
|
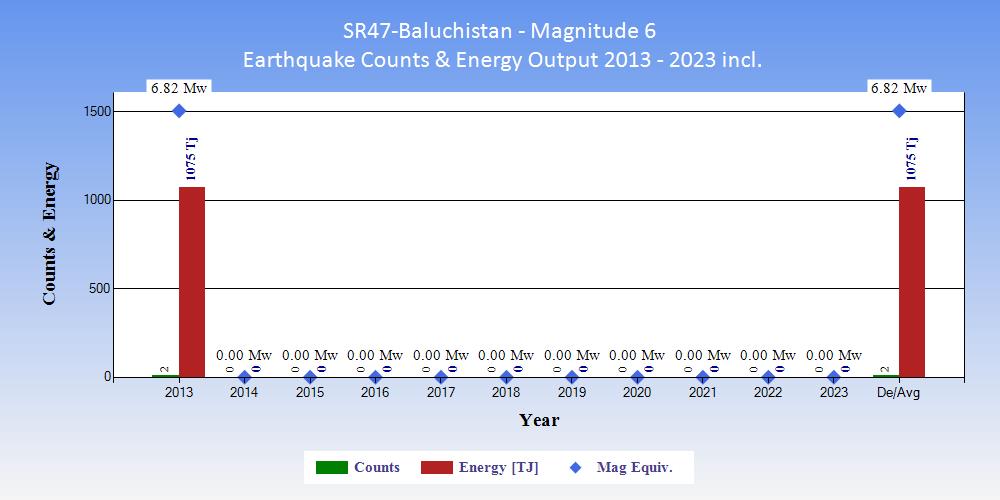
| Tables showing the ranking of 2023 within the 11 years 2013 to 2023 inclusive in terms of counts of earthquakes and energy output. |
|
|
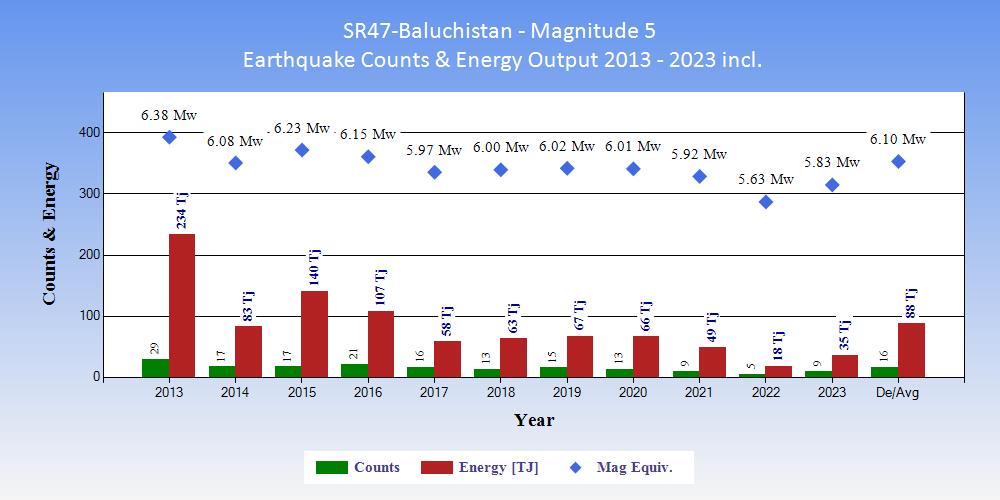
| Tables showing the ranking of 2023 within the 11 years 2013 to 2023 inclusive in terms of counts of earthquakes and energy output. |
|
|
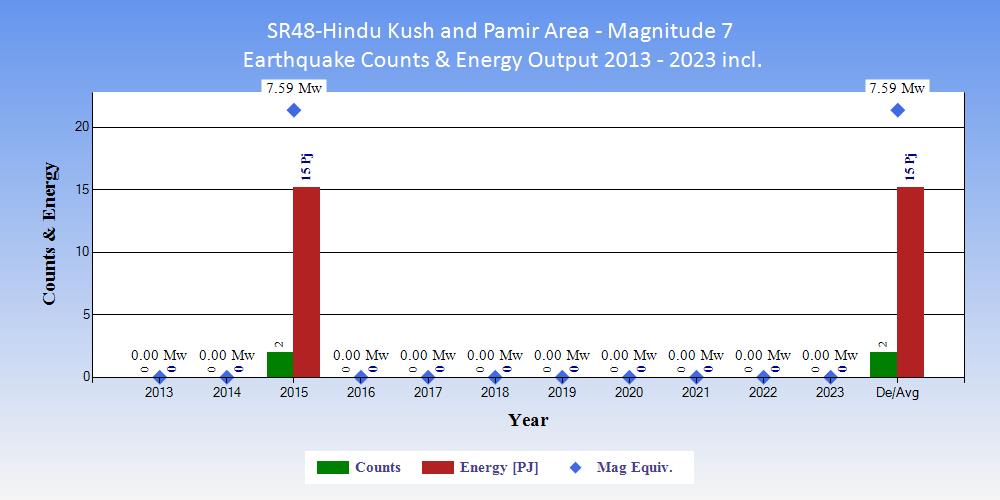
| Tables showing the ranking of 2023 within the 11 years 2013 to 2023 inclusive in terms of counts of earthquakes and energy output. |
|
|
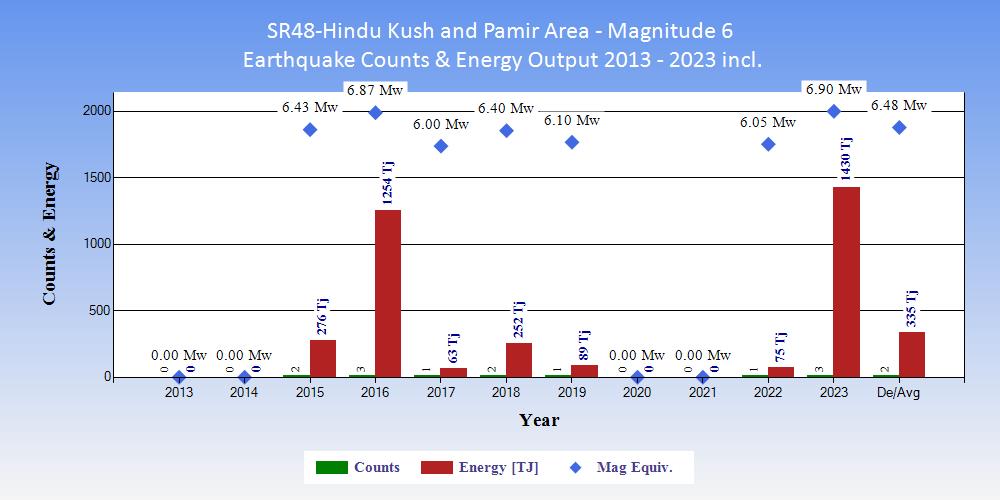
| Tables showing the ranking of 2023 within the 11 years 2013 to 2023 inclusive in terms of counts of earthquakes and energy output. |
|
|
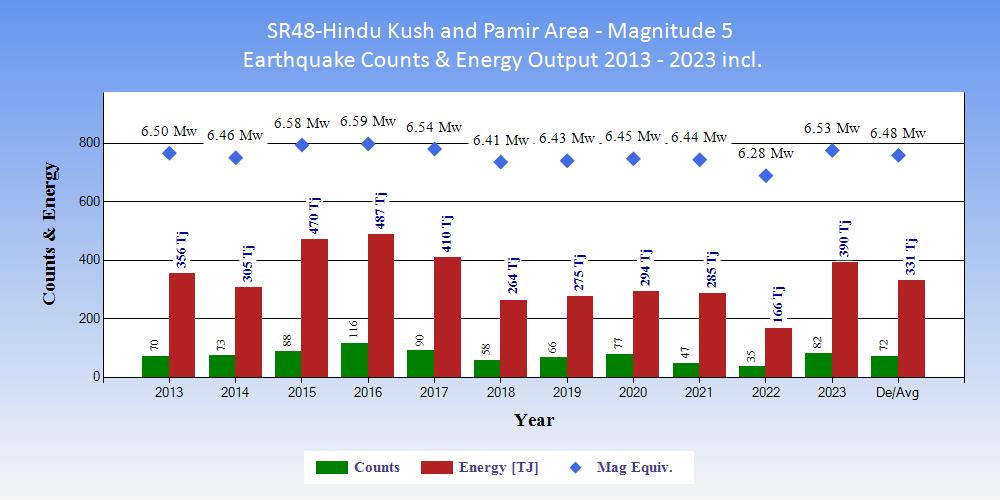
| Tables showing the ranking of 2023 within the 11 years 2013 to 2023 inclusive in terms of counts of earthquakes and energy output. |
|
|
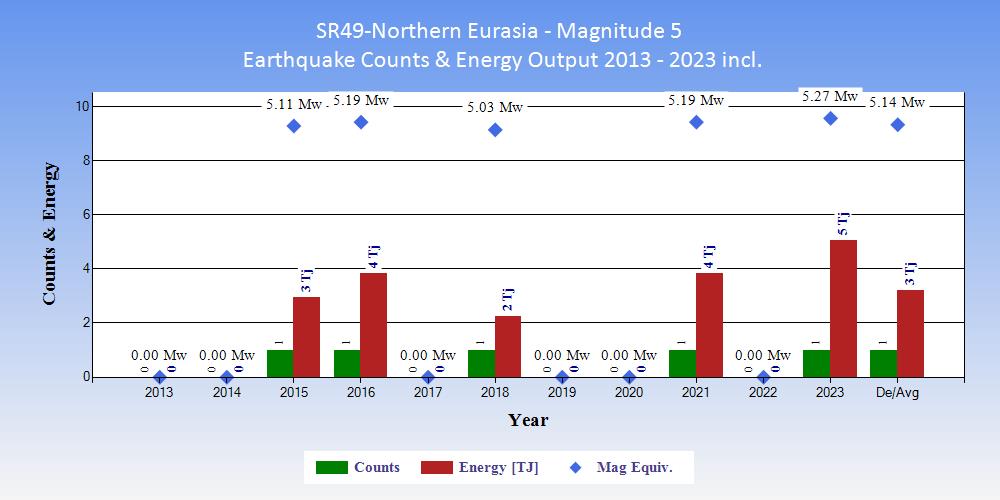
| Tables showing the ranking of 2023 within the 11 years 2013 to 2023 inclusive in terms of counts of earthquakes and energy output. |
|
|
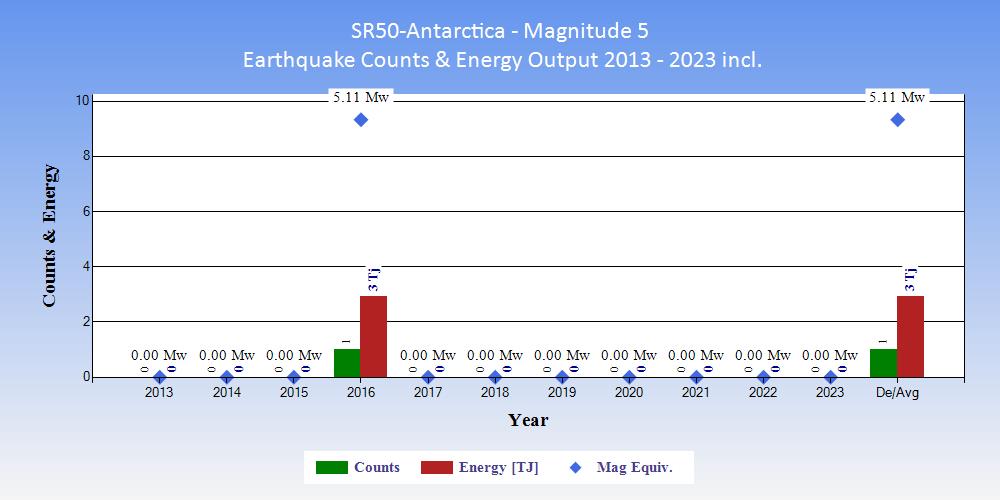
| Tables showing the ranking of 2023 within the 11 years 2013 to 2023 inclusive in terms of counts of earthquakes and energy output. |
|
|