Last Updated on April 20, 2026 by Webmaster
Summary of report week: USGS is listing 20 events, EMSC is listing 23 events and GFZ Potsdam is listing 26 events. You can view each of these listings below. No active category force storms. Max 6 actively erupting volcanoes on any single day over and above the 17 always erupting.
Using converted magnitudes (mb to Mw etc) USGS converts to 69 events and EMSC converts to 70 events. Potsdam events cannot normally be converted as the scale is not known.
Earthquakes for w/e 13 September 2013
Full details of Mag 6+ earthquakes can be found here but the block details of USGS provided M6+ are shown below.
The listings for each of the main global providers is shown below. All times are in Universal Coordinated Time (UTC)
20 events from USGS (See expanded details if any for links to USGS or in line links for Quake Watch or Google location map)
Date/Time UTC,Latitude,Longitude,Magnitude,Depth(Km),Location
2013-09-13 19:30, -53.7828, 2.479, 5.0 mb, 14.8, 91Km Nw Of Bouvet Island. Bouvet Island {Map}
2013-09-13 09:05, -24.7476, 178.6978, 5.0 mb, 527.1, South Of The Fiji Islands {Map}
2013-09-12 15:25, 51.6986, -171.2948, 5.1 mb, 24.0, 87Km S Of Amukta Island. Alaska {Map}
2013-09-12 13:03, 13.2434, -90.2401, 5.1 mb, 50.4, 59Km Sw Of Acajutla. El Salvador {Map}
2013-09-12 09:03, -7.4436, 128.3223, 5.2 mb, 172.0, Kepulauan Barat Daya. Ind. {Map}
2013-09-11 12:44, -4.6484, -104.8181, 5.7 Mwp, 9.6, Central E. Pacific Rise {Map}
2013-09-10 01:12, 1.3582, 122.1739, 5.2 mb, 34.9, 71Km Ene Of Bunobogu. Ind. {Map}
2013-09-10 00:35, 15.4445, -46.7187, 5.1 mb, 8.2, Nthn Mid-Atlantic Ridge {Map}
2013-09-09 21:41, 1.4284, 122.2205, 5.7 Mwp, 46.2, 80Km Ene Of Bunobogu. Ind. {Map}
2013-09-09 16:58, -10.6432, 164.6583, 5.1 mb, 34.2, 128Km W Of Lata. Solomon Islands {Map}
2013-09-09 16:31, -10.6617, 164.7556, 5.2 mb, 20.4, 118Km W Of Lata. Solomon Islands {Map}
2013-09-09 03:28, 22.9842, 95.9605, 5.0 mb, 23.2, 53Km Nne Of Shwebo. Burma {Map}
2013-09-08 17:30, 36.5368, 70.1321, 5.2 mb, 211.6, 24Km E Of Farkhar. Afghanistan {Map}
2013-09-08 09:27, 9.069, 126.1786, 5.0 mb, 96.1, 2Km Wsw Of Tandag. Philippines {F} {Map}
2013-09-08 04:59, 34.723, 25.0946, 5.0 mb, 4.9, 31Km S Of Pirgos. Greece {F} {Map}
2013-09-07 19:13, -19.5491, -68.8547, 5.0 mb, 91.2, 154Km Ene Of Iquique. Chile {Map}
2013-09-07 16:39, -15.2053, -173.5478, 5.0 mb, 10.0, 85Km Nne Of Hihifo. Tonga {Map}
2013-09-07 13:55, -6.4408, 130.3046, 5.5 mb, 118.2, 200Km Nnw Of Saumlaki. Ind. {Map}
2013-09-07 00:20, 14.3098, -91.7844, 5.4 mb, 64.9, 14Km E Of Champerico. Guatemala {F} {Map}
2013-09-07 00:13, 14.6435, -92.1042, 6.6 Mww, 67.0, Near Coast Of Chiapas. Mexico {Map}
Mag 6+ events brief details
Magnitude 6.6 Near Coast Of Chiapas. Mexico
Saturday, September 07, 2013 @ 00:13:29 UTC
Location in Google Maps
- Location: 14.644°N, 92.104°W
- Depth: 67.0 km
-
Region: Near Coast Of Chiapas. Mexico
- Distances:
- 5km (3mi) ESE of Ciudad Tecun Uman, Guatemala
- 15km (9mi) NE of Suchiate, Mexico
- 26km (16mi) WSW of Coatepeque, Guatemala
- 28km (17mi) SSW of Malacatan, Guatemala
- 171km (106mi) W of Guatemala City, Guatemala
- Event ID: usb000jkmw
All earthquakes in the list and the expanded details (if any) above, are sourced from USGS Links go to the USGS web site but if you are viewing this more than 30 days after the event the web page will not be available unless it was a significant quake.
23 events from EMSC
Date/Time UTC,Latitude,Longitude,Magnitude,Depth(Km),Location
2013-09-13 19:30, -53.8662, 2.6027, 5.0 mb, 40.0, Bouvet Island Rgn {Map}
2013-09-13 09:05, -24.828, 178.7273, 5.1 mb, 544.0, South Of Fiji Islands {Map}
2013-09-12 15:25, 51.7679, -171.2563, 5.0 mb, 22.0, Fox Islands Aleutian Islands {Map}
2013-09-12 12:32, 9.1576, 125.6947, 5.0 mb, 50.0, Mindanao Philippines {Map}
2013-09-12 09:03, -7.5629, 128.3872, 5.1 Mw, 187.0, Kepulauan Barat Daya Ind. {Map}
2013-09-12 04:20, -25.7754, 179.23, 5.0 mb, 545.0, South Of Fiji Islands {Map}
2013-09-11 12:44, -4.6146, -104.9153, 6.1 Mw, 13.0, Central E. Pacific Rise {Map}
2013-09-10 12:27, -46.026, 95.6522, 5.3 Mw, 10.0, Se Indian Ridge {Map}
2013-09-10 01:12, 1.4941, 122.3328, 5.3 mb, 24.0, Minahasa Sulawesi Ind. {Map}
2013-09-10 00:35, 15.4916, -46.6732, 5.0 mb, 10.0, Nthn Mid Atlantic Ridge {Map}
2013-09-09 21:41, 1.4003, 122.3148, 5.6 Mw, 53.0, Minahasa Sulawesi Ind. {Map}
2013-09-09 16:58, -10.6312, 164.7131, 5.1 mb, 30.0, Santa Cruz Islands Rgn {Map}
2013-09-09 16:31, -10.6461, 164.7871, 5.1 mb, 10.0, Santa Cruz Islands Rgn {Map}
2013-09-09 03:28, 23.0812, 95.9253, 5.0 mb, 10.0, Myanmar {Map}
2013-09-08 18:57, 29.1034, 179.9913, 5.0 mb, 2.0, Hawaiian Islands Rgn {Map}
2013-09-08 17:30, 36.592, 70.3601, 5.1 mb, 215.0, Hindu Kush Rgn Afghanistan {Map}
2013-09-08 09:27, 9.0938, 126.3155, 5.1 mb, 80.0, Mindanao Philippines {Map}
2013-09-07 19:13, -19.539, -69.0521, 5.0 mb, 94.0, Tarapaca Chile {Map}
2013-09-07 16:39, -15.1889, -173.4567, 5.1 mb, 2.0, Tonga {Map}
2013-09-07 15:51, 51.5302, -174.2839, 5.1 mb, 30.0, Andreanof Islands Aleutian Is. {Map}
2013-09-07 13:55, -6.525, 130.3636, 5.7 mb, 130.0, Banda Sea {Map}
2013-09-07 13:12, 51.5342, -174.377, 5.1 mb, 40.0, Andreanof Islands Aleutian Is. {Map}
2013-09-07 00:13, 14.771, -92.0034, 6.5 Mw, 67.0, Guatemala {Map}
All earthquakes in the above list are sourced from EMSC. Magnitude 6 and upwards events link directly to the EMSC web site for the event.
26 events from GFZ Potsdam
Date/Time UTC,Latitude,Longitude,Magnitude,Depth(Km),Location
2013-09-13 09:05, -24.73, 178.62, 5.0 M, 526.0, South Of Fiji Islands {Map}
2013-09-13 04:06, -1.02, 127.14, 5.0 M, 12.0, Halmahera. Ind. {Map}
2013-09-12 15:25, 51.55, -171.23, 5.0 M, 19.0, Fox Isls. Aleutian Islands {Map}
2013-09-12 13:03, 13.27, -90.26, 5.0 M, 59.0, Nr. Coast Of Guatemala {Map}
2013-09-12 12:32, 9.25, 125.73, 5.0 M, 27.0, Mindanao. Philippines {Map}
2013-09-12 09:03, -7.52, 128.36, 5.1 M, 184.0, Banda Sea {Map}
2013-09-12 04:20, -25.57, 179.24, 5.0 M, 518.0, South Of Fiji Islands {Map}
2013-09-11 12:44, -4.61, -104.83, 6.0 M, 10.0, Central E. Pacific Rise {Map}
2013-09-10 19:43, -33.76, -178.94, 5.0 M, 35.0, South Of Kermadec Islands {Map}
2013-09-10 12:27, -46.02, 95.89, 5.3 M, 10.0, Se Indian Ridge {Map}
2013-09-10 07:04, -20.23, -173.67, 5.0 M, 10.0, Tonga Islands {Map}
2013-09-10 01:12, 1.43, 122.37, 5.2 M, 37.0, Minahassa Peninsula. Sulawesi {Map}
2013-09-10 00:35, 15.38, -46.75, 5.2 M, 10.0, Nthn Mid Atlantic Ridge {Map}
2013-09-09 21:41, 1.4, 122.34, 5.5 M, 45.0, Minahassa Peninsula. Sulawesi {Map}
2013-09-09 16:58, -10.64, 164.76, 5.2 M, 32.0, Santa Cruz Islands Rgn {Map}
2013-09-09 16:31, -10.64, 164.85, 5.2 M, 21.0, Santa Cruz Islands Rgn {Map}
2013-09-09 13:20, 51.76, -175.34, 5.0 M, 35.0, Andreanof Isls. Aleutian Islands {Map}
2013-09-08 18:57, 28.96, -180, 5.0 M, 10.0, Hawaiian Islands Rgn {Map}
2013-09-08 17:30, 36.55, 70.23, 5.0 M, 204.0, Hindu Kush Rgn. Afghanistan {Map}
2013-09-08 09:27, 9.18, 126.38, 5.1 M, 65.0, Mindanao. Philippines {Map}
2013-09-07 16:39, -15.21, -172.87, 5.0 M, 10.0, Samoa Islands Rgn {Map}
2013-09-07 15:51, 51.63, -174.31, 5.0 M, 18.0, Andreanof Isls. Aleutian Islands {Map}
2013-09-07 13:55, -6.47, 130.34, 5.3 M, 131.0, Banda Sea {Map}
2013-09-07 13:12, 51.67, -174.36, 5.1 M, 10.0, Andreanof Isls. Aleutian Islands {Map}
2013-09-07 00:20, 14.37, -91.77, 5.3 M, 78.0, Guatemala {Map}
2013-09-07 00:13, 14.8, -92, 6.4 M, 87.0, Nr. Coast Of Chiapas. Mexico {Map}
All earthquakes in the above list are sourced from GFZ Potsdam Links on Mag 6 and greater go direct to the GFZ Potsdam web page for the event.
All Magnitudes trend 5+
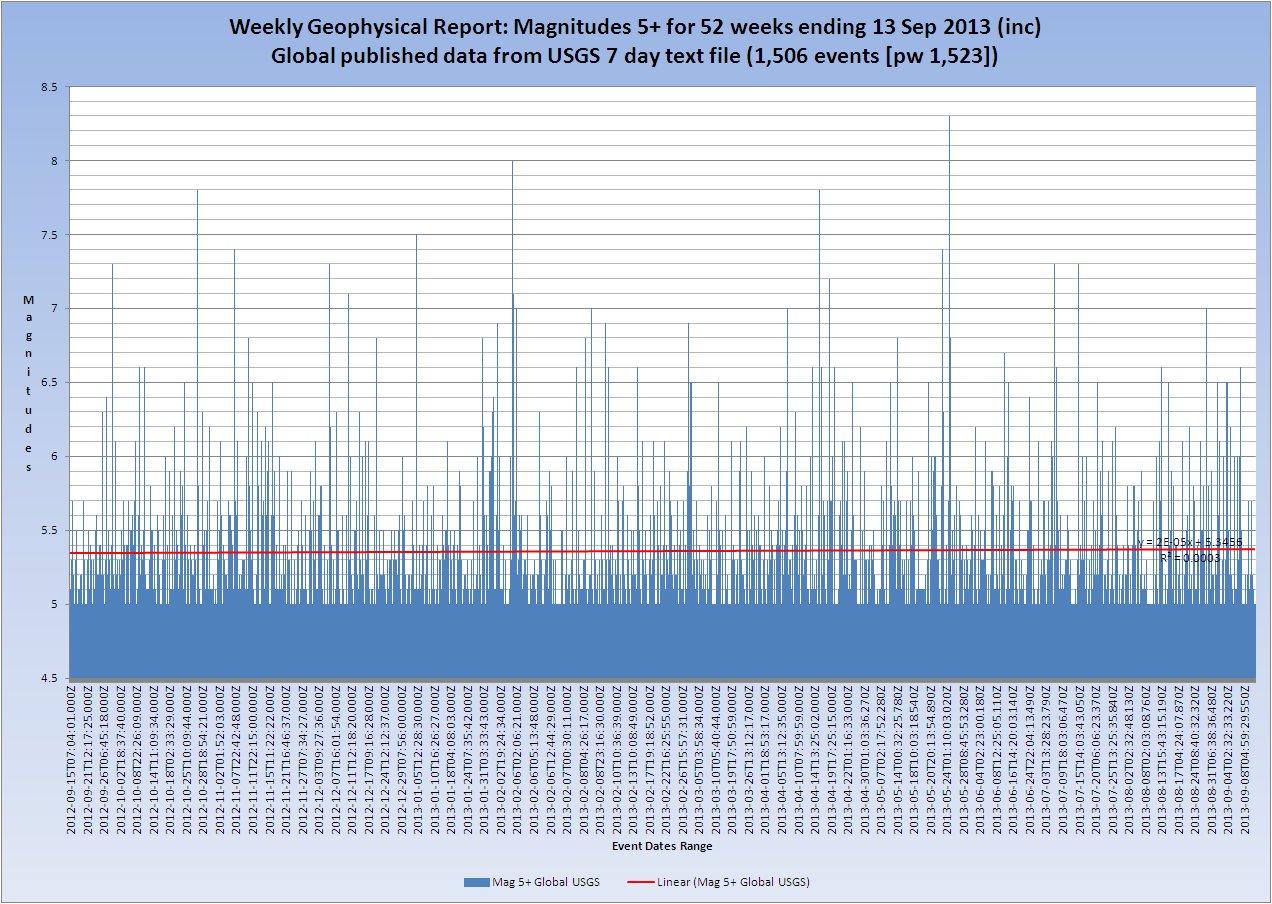
(USGS published values. Click the Image for a larger/clearer version)
Mag 5.0 to 5.9 magnitudes trend.
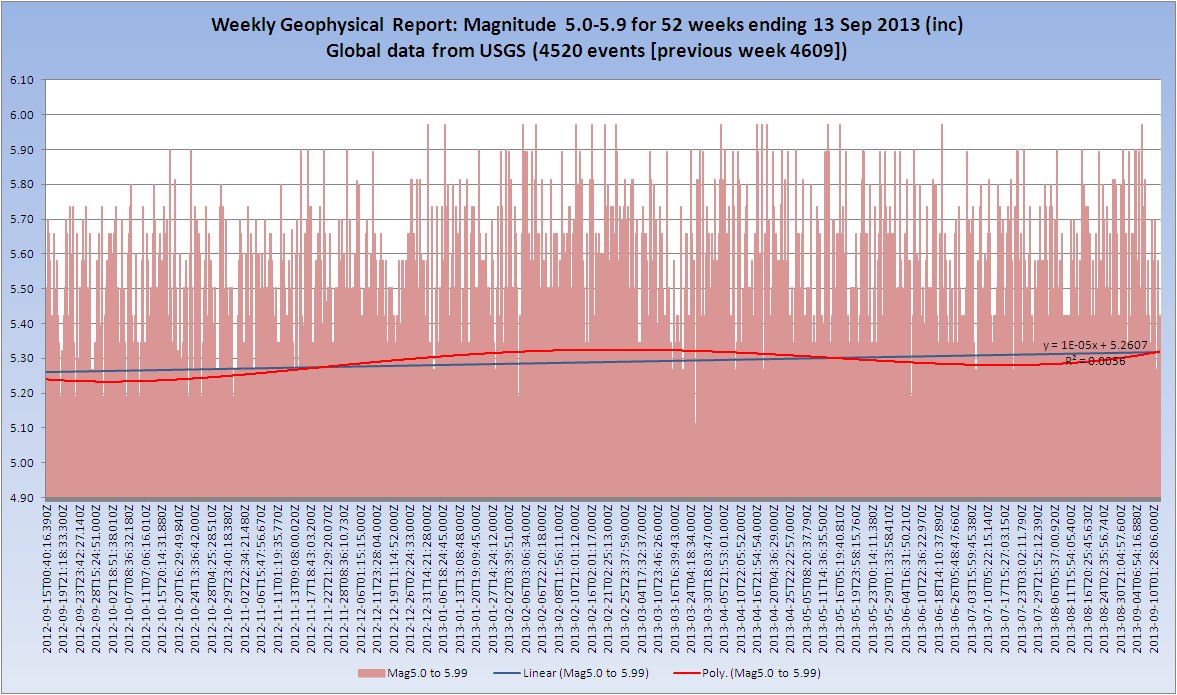
(USGS converted values. Click the Image for a larger/clearer version)
Mag 5.0 to 5.9 published magnitudes this week
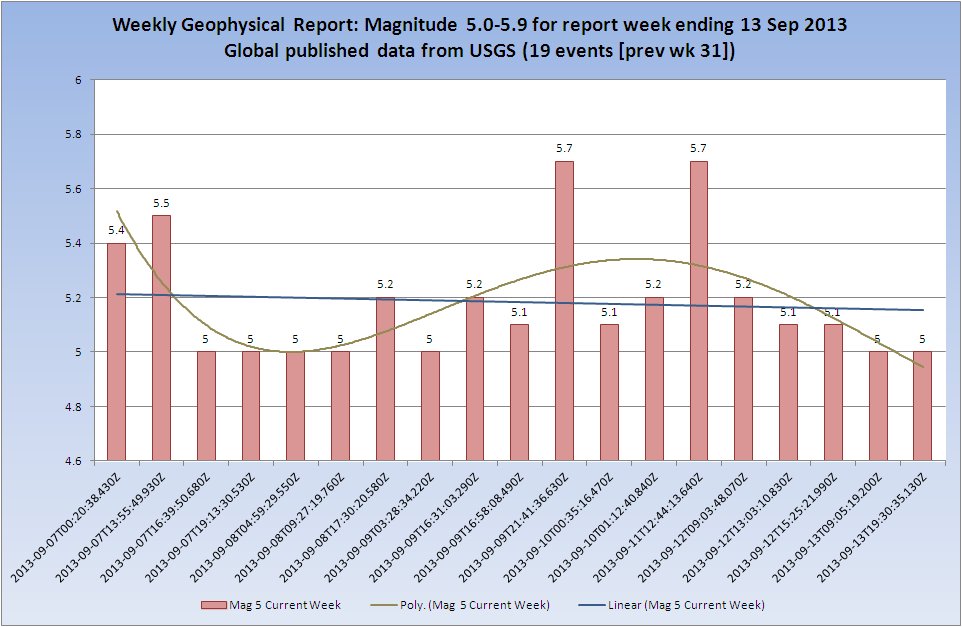
(USGS published values. Click the Image for a larger/clearer version)
Mag 5.0 to 5.9 converted magnitudes this week
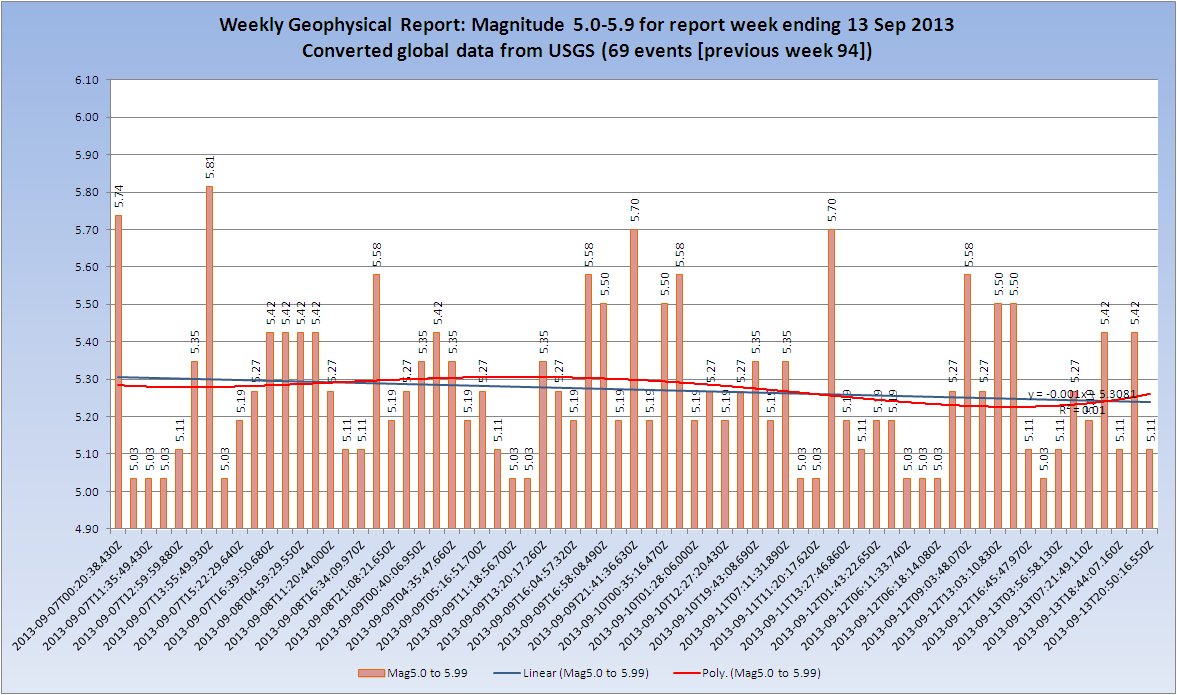
(USGS converted values. Click the Image for a larger/clearer version)
Mag 5.0 published/converted comparison
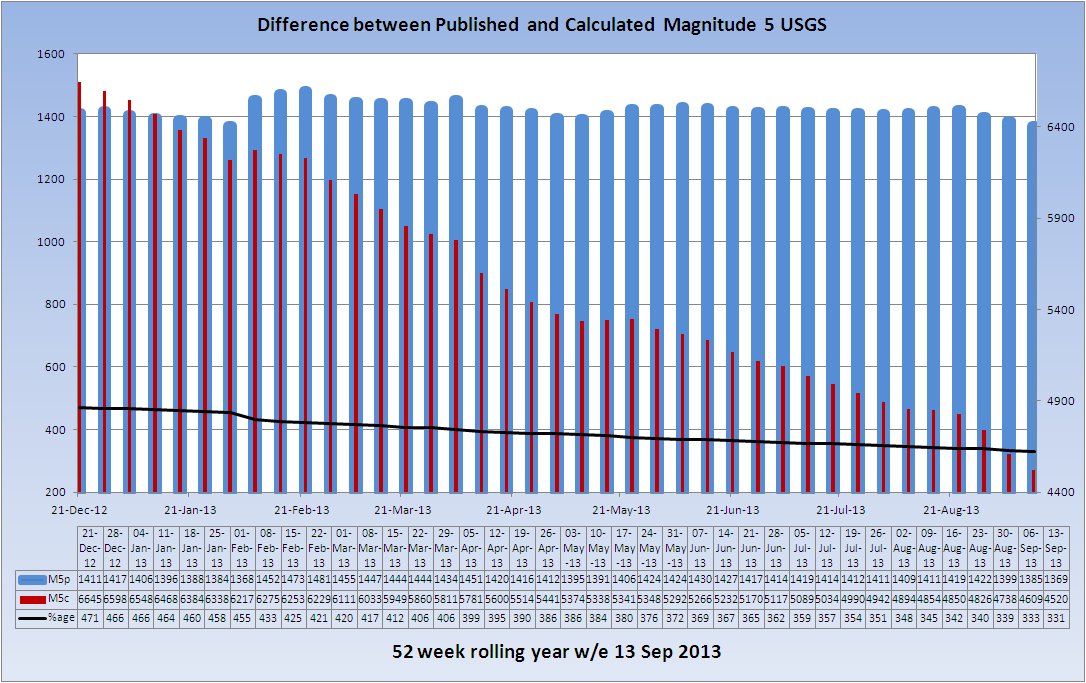
(Click the Image for a larger/clearer version)
Mag 6.0 to 6.9 magnitudes trend.

(USGS published values. Click the Image for a larger/clearer version)
Peaks of Inactivity M6
Shows the days in between Mag 6 band events. Days where a Mag 6 earthquake occurs are zero on the chart.
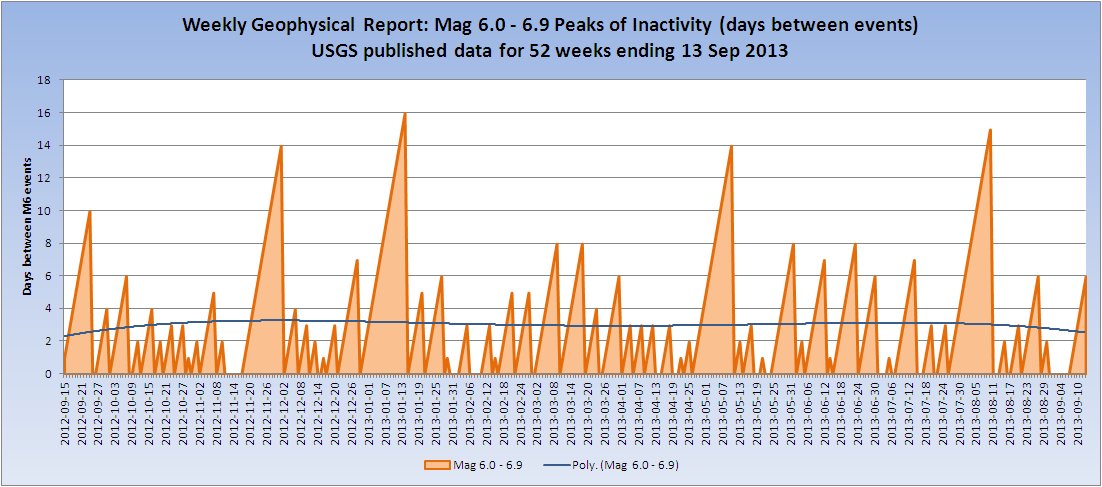
(USGS published values. Click the Image for a larger/clearer version)
Mag 7.0 to 7.9 magnitudes trend.
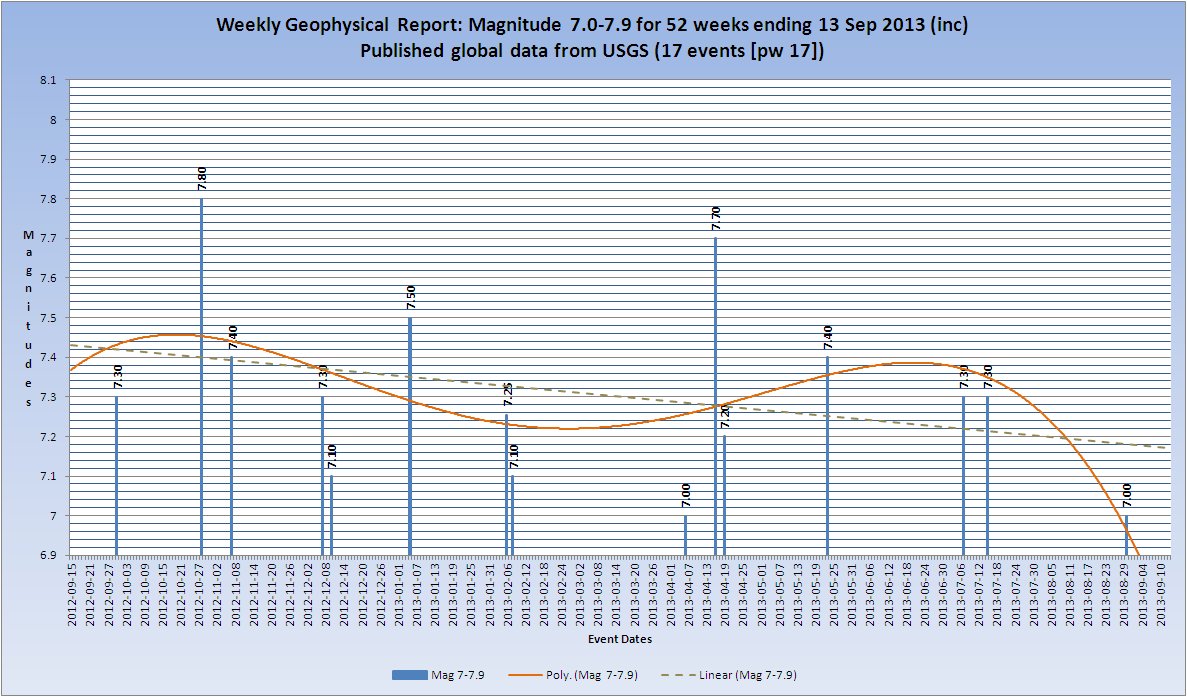
(USGS published values. Click the Image for a larger/clearer version)
Peaks of Inactivity M7
Shows the days in between Mag 7 band events. Days where a Mag 7 earthquake occurs are zero on the chart.
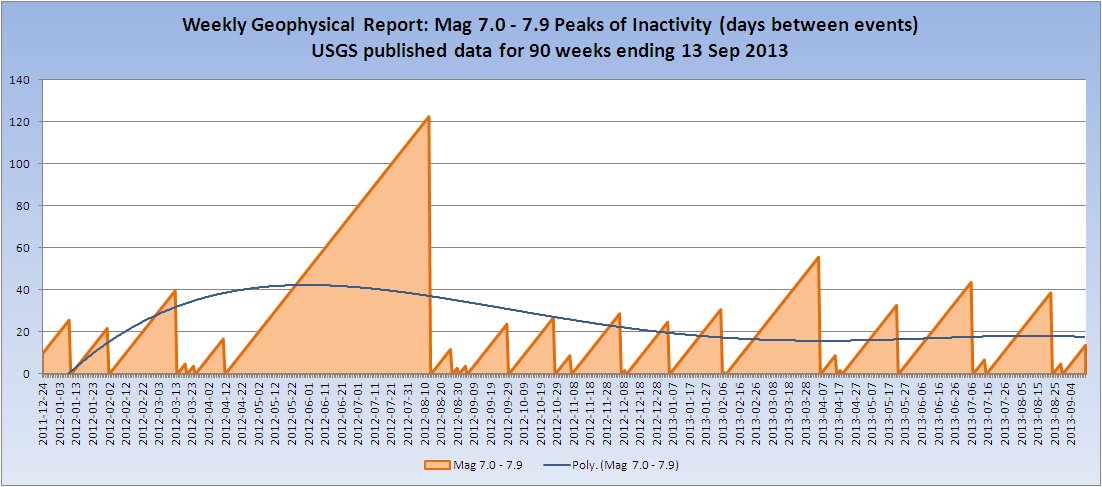
(USGS published values. Click the Image for a larger/clearer version)
Mag 8.0+ magnitudes trend
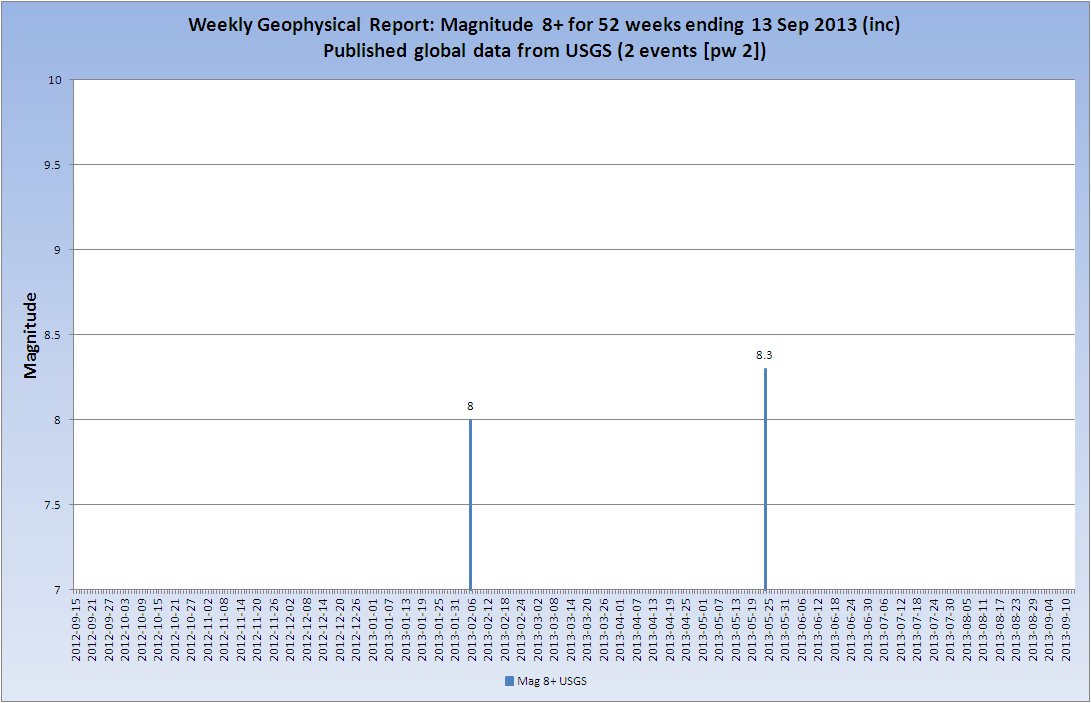
(USGS published values. Click the Image for a larger/clearer version)
Earthquake Statistics
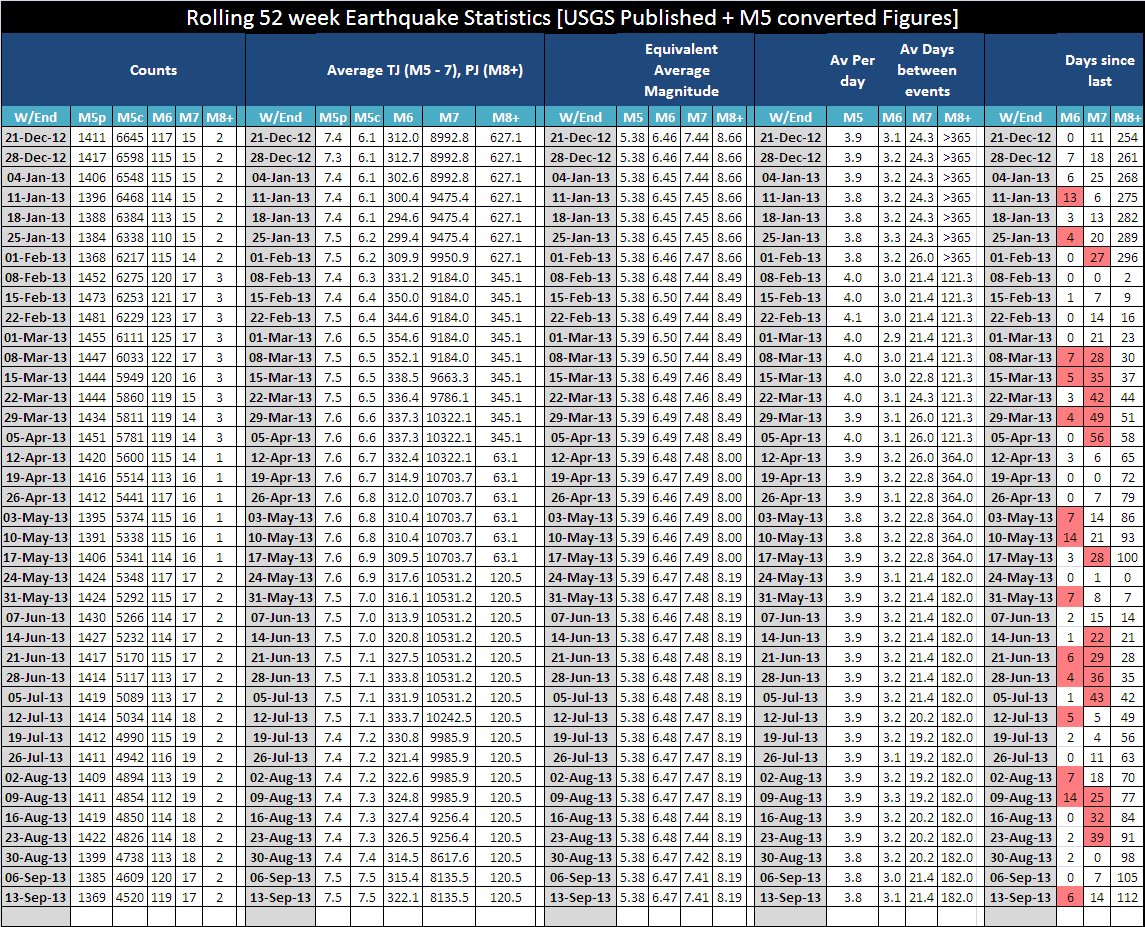
(Click the Image for a larger/clearer version)
(See explanation here.)
Rolling 52 Week M5 Counts and Energy(USGS Published & Calculated)
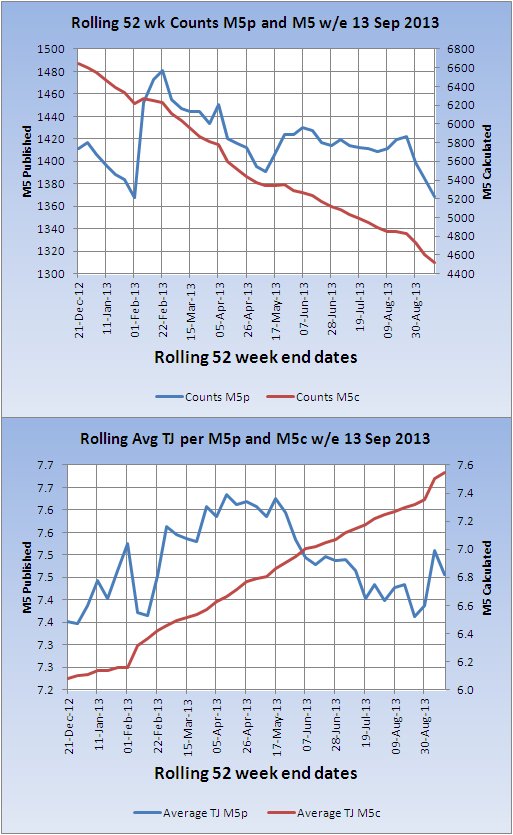
Rolling 52 Week M6 Counts and Energy(USGS Published)
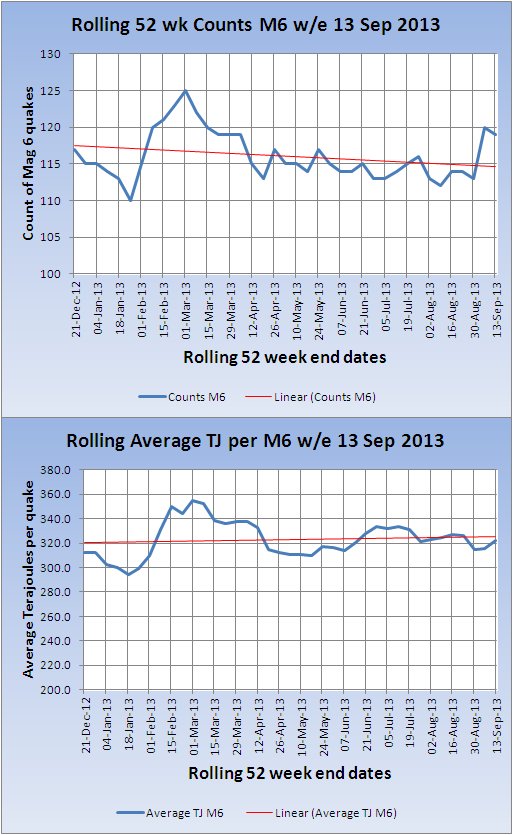
Rolling 52 Week M7 Counts and Energy(USGS Published)
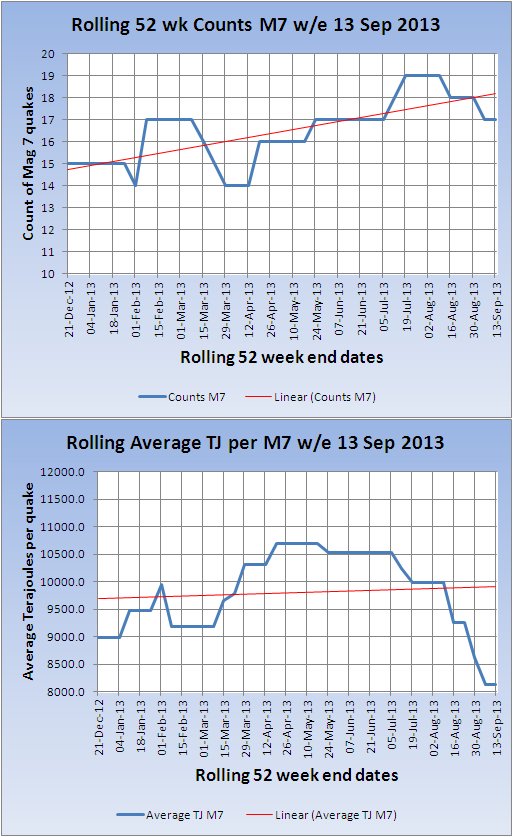
Rolling 52 Week M8 Counts and Energy(USGS Published)
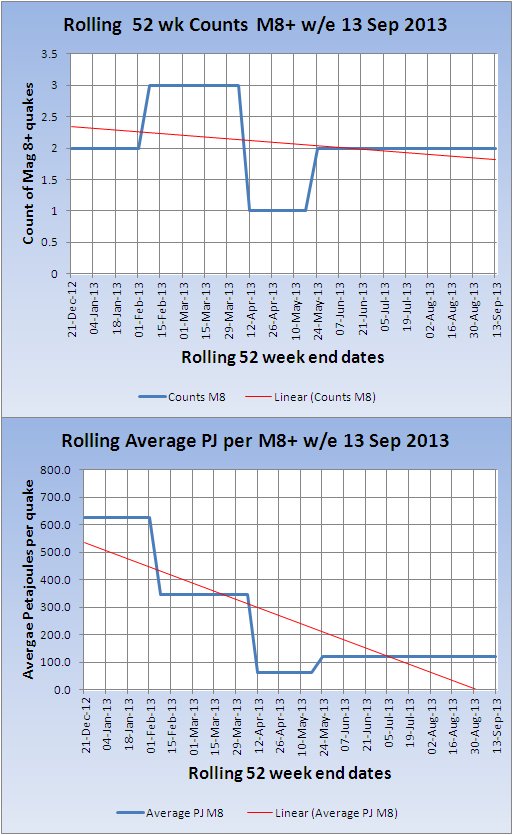
Rolling Global Counts -v- Energy(USGS Published)
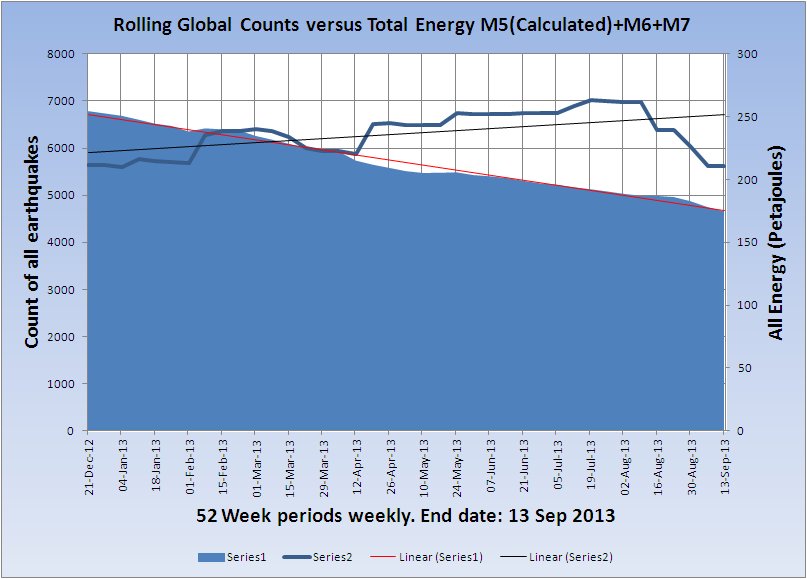
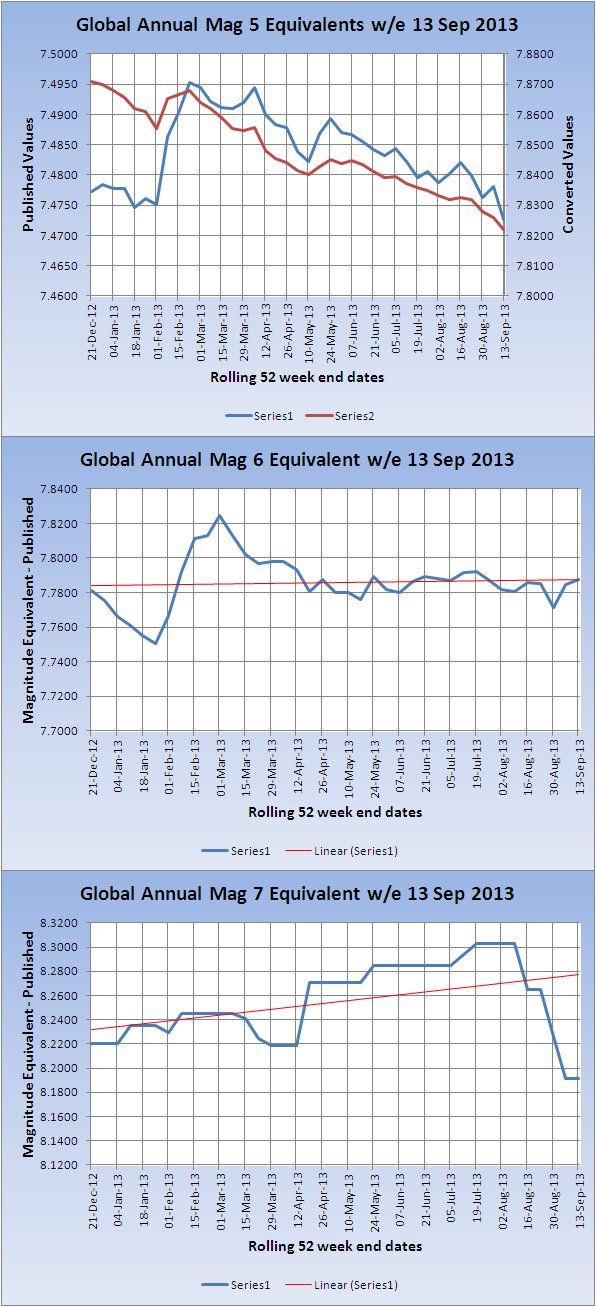
Global Single Magnitude Equivalent
This represents the total energy output of Mag 5+ Published USGS earthquakes, in a rolling 52 week period, summed and converted back to an approximate single magnitude value, i.e. the magnitude of a quake of comparable energy value.
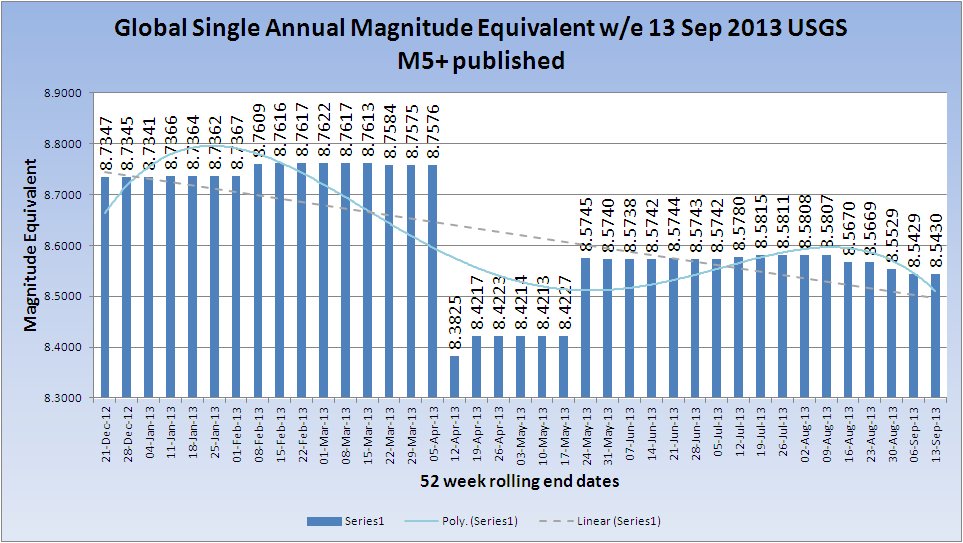
(Click the Image for a larger/clearer version)
Global Single Magnitude Equivalents By Mag Band
Volcanoes
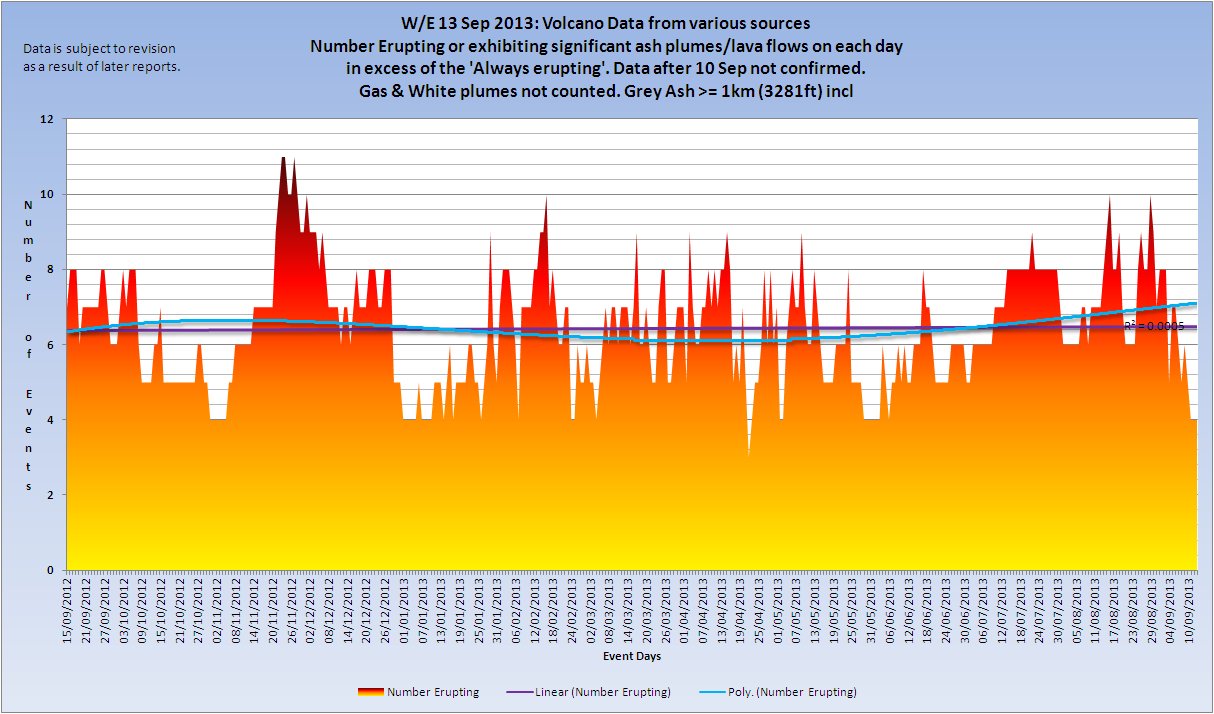
Volcano information gathered from various sources, including the Smithsonian Weekly Volcanic Activity Report from which confirmation of reports is taken.
A volcano is only included in the listing if there is significant ash above 1km height (white/steam clouds are not counted) or there is a significant lava flow. Crater incandescence, unless accompanied by the either of the preceding does qualify as an eruption.
Volcano Chart
(Click the Image for a larger/clearer version)
Volcanoes erupting this week contributing to the chart.
Fuego (Guatemala)
Kizimen (Kamchatka. Russia)
Kliuchevskoi (Russia)
Lokon-Empung (Indonesia)
Reventador (Ecuador)
Shiveluch (Kamchatka. Russia)
Veniaminof (United States)
KVERT web page: Kamchatka and the Northern Kuriles volcanoes: Erupting or Restless
Volcanic Ash Advisory Centre advisories
Anchorage VAAC
Australian VAAC
Buenos Aires VAAC
London VAAC
Montréal VAAC
Tokyo VAAC
Toulouse VAAC
Washington VAAC
Wellington VAAC
Aviation Colour Codes
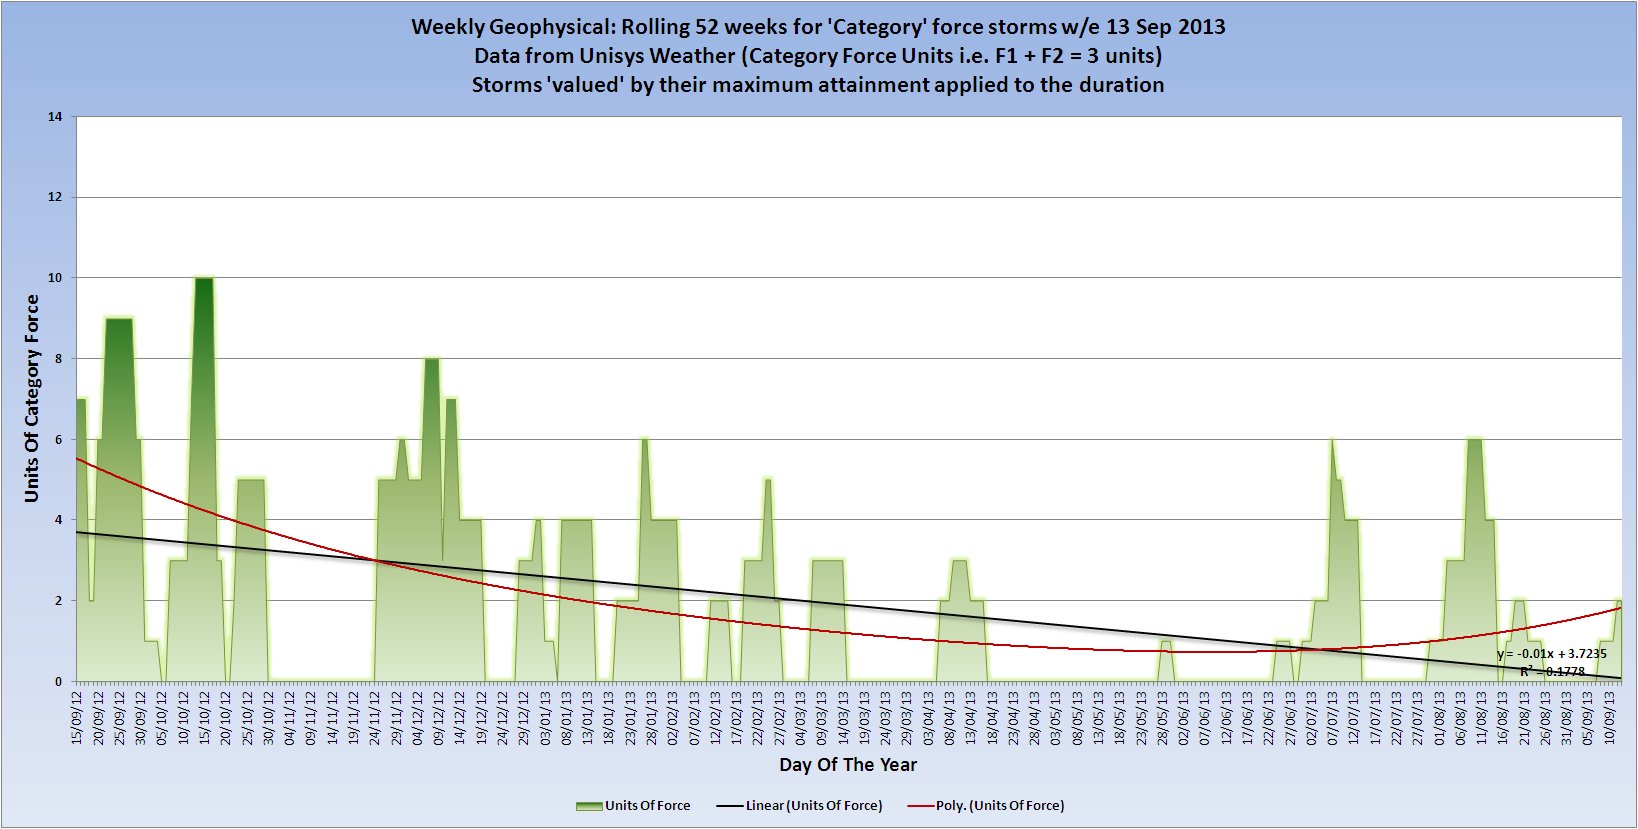
Category 1+ storms
Cat 1+ Storms Chart
(Click the Image for a larger/clearer version)
There was 1 category force storms active on the day of the report.
Hurricane-1 HUMBERTO
Hurricane-1 INGRID was not yet a hurricane
There was 1 category force storms active during the week of the report.
Hurricane-1 HUMBERTO
Hurricane-1 INGRID was not yet a hurricane
Hurricane-1 HUMBERTO
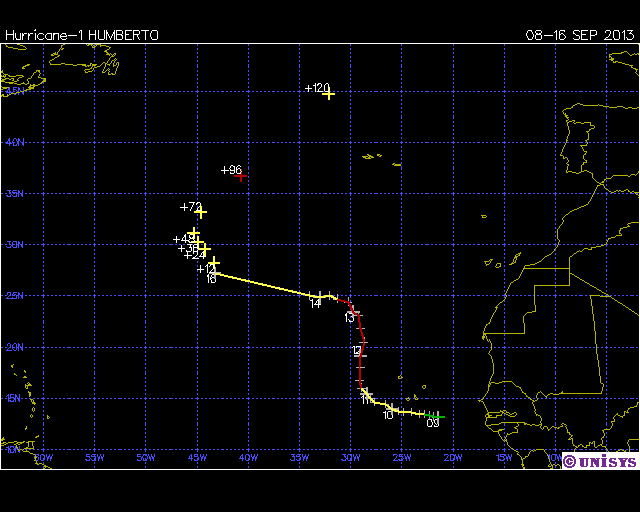
Date: 08-16 SEP 2013
Hurricane-1 HUMBERTO
ADV  LAT    LON      TIME     WIND  PR  STAT
  1  13.10  -20.70 09/08/21Z   25  1007 TROPICAL DEPRESSION
 1A  13.10  -21.40 09/09/00Z   25  1007 TROPICAL DEPRESSION
  2  13.20  -21.90 09/09/03Z   30  1006 TROPICAL DEPRESSION
 2A  13.30  -22.30 09/09/06Z   30  1005 TROPICAL DEPRESSION
  3  13.40  -22.80 09/09/09Z   35  1005 TROPICAL STORM
 3A  13.40  -23.30 09/09/12Z   35  1005 TROPICAL STORM
  4  13.60  -24.10 09/09/15Z   40  1005 TROPICAL STORM
 4A  13.60  -24.80 09/09/18Z   40  1005 TROPICAL STORM
  5  13.70  -25.30 09/09/21Z   45  1002 TROPICAL STORM
  6  13.90  -25.90 09/10/03Z   50  1000 TROPICAL STORM
  7  14.40  -26.60 09/10/09Z   55   998 TROPICAL STORM
  8  14.60  -27.70 09/10/15Z   55   998 TROPICAL STORM
  9  15.00  -28.10 09/10/21Z   60   993 TROPICAL STORM
 10  15.40  -28.40 09/11/03Z   60   995 TROPICAL STORM
 11  16.00  -28.90 09/11/09Z   65   992 HURRICANE-1
 12  16.70  -29.10 09/11/15Z   70   989 HURRICANE-1
 13  18.00  -29.00 09/11/21Z   75   986 HURRICANE-1
 14  19.10  -29.00 09/12/03Z   75   982 HURRICANE-1
 15  20.50  -28.70 09/12/09Z   75   982 HURRICANE-1
 16  21.80  -29.00 09/12/15Z   75   982 HURRICANE-1
 17  23.10  -29.20 09/12/21Z   75   982 HURRICANE-1
 18  23.40  -29.70 09/13/03Z   70   984 HURRICANE-1
 19  24.40  -30.20 09/13/09Z   65   984 HURRICANE-1
 20  24.70  -31.30 09/13/15Z   55   991 TROPICAL STORM
 21  25.00  -32.10 09/13/21Z   45   996 TROPICAL STORM
 22  24.80  -33.00 09/14/03Z   40   999 TROPICAL STORM
 23  25.00  -34.00 09/14/09Z   35  1003 TROPICAL STORM
 25  27.20  -43.20 09/16/15Z   35  1007 TROPICAL STORM
+12  28.20  -43.30 09/17/00Z   35     - TROPICAL STORM
+24  29.50  -44.20 09/17/12Z   40     - TROPICAL STORM
+36  30.20  -44.90 09/18/00Z   40     - TROPICAL STORM
+48  31.10  -45.30 09/18/12Z   45     - TROPICAL STORM
+72  33.10  -44.60 09/19/12Z   55     - TROPICAL STORM
+96  36.70  -40.70 09/20/12Z   65     - HURRICANE-1
+120  44.70  -32.10 09/21/12Z   60     - TROPICAL STORM
Hurricane-1 INGRID
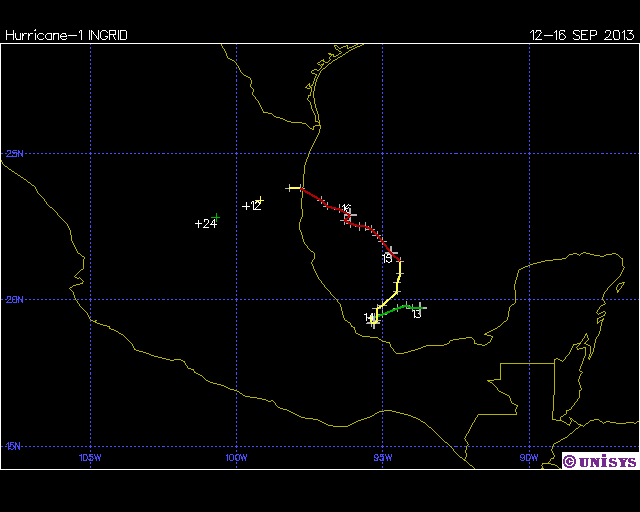
Date: 12-16 SEP 2013
Hurricane-1 INGRID
ADV  LAT    LON      TIME     WIND  PR  STAT
  1  19.70  -93.60 09/12/21Z   30  1003 TROPICAL DEPRESSION
 1A  19.70  -93.70 09/13/00Z   30  1003 TROPICAL DEPRESSION
  2  19.70  -94.00 09/13/03Z   30  1003 TROPICAL DEPRESSION
 2A  19.80  -94.20 09/13/06Z   30  1003 TROPICAL DEPRESSION
  3  19.70  -94.50 09/13/09Z   30  1002 TROPICAL DEPRESSION
 3A  19.50  -95.00 09/13/12Z   30  1000 TROPICAL DEPRESSION
  4  19.40  -95.30 09/13/15Z   40  1000 TROPICAL STORM
 4A  19.40  -95.40 09/13/18Z   40   999 TROPICAL STORM
  5  19.20  -95.40 09/13/21Z   40   999 TROPICAL STORM
  6  19.20  -95.30 09/14/00Z   50   993 TROPICAL STORM
  7  19.30  -95.20 09/14/03Z   50   993 TROPICAL STORM
 7A  19.70  -95.20 09/14/06Z   50   993 TROPICAL STORM
  8  19.80  -95.00 09/14/09Z   50   991 TROPICAL STORM
 8A  20.30  -94.50 09/14/12Z   55   989 TROPICAL STORM
  9  20.60  -94.50 09/14/15Z   60   988 TROPICAL STORM
 9A  20.90  -94.40 09/14/18Z   60   988 TROPICAL STORM
 10  21.30  -94.40 09/14/21Z   65   987 HURRICANE-1
10A  21.60  -94.70 09/15/00Z   70   983 HURRICANE-1
 11  22.00  -95.00 09/15/03Z   75   986 HURRICANE-1
11A  22.20  -95.20 09/15/06Z   75   986 HURRICANE-1
 12  22.40  -95.40 09/15/09Z   75   986 HURRICANE-1
12A  22.50  -95.60 09/15/12Z   75   986 HURRICANE-1
 13  22.50  -95.80 09/15/15Z   65   990 HURRICANE-1
13A  22.60  -96.10 09/15/18Z   65   990 HURRICANE-1
 14  22.70  -96.30 09/15/21Z   65   990 HURRICANE-1
14A  22.90  -96.10 09/16/00Z   65   987 HURRICANE-1
 15  23.10  -96.50 09/16/03Z   65   989 HURRICANE-1
15A  23.20  -96.90 09/16/06Z   65   989 HURRICANE-1
 16  23.40  -97.10 09/16/09Z   65   989 HURRICANE-1
16A  23.80  -97.80 09/16/12Z   55   991 TROPICAL STORM
 17  23.80  -98.20 09/16/15Z   50   993 TROPICAL STORM
+12  23.40  -99.20 09/17/00Z   35     - TROPICAL STORM
+24  22.80 -100.70 09/17/12Z   25     - TROPICAL DEPRESSION
Chart by daily category attaiment
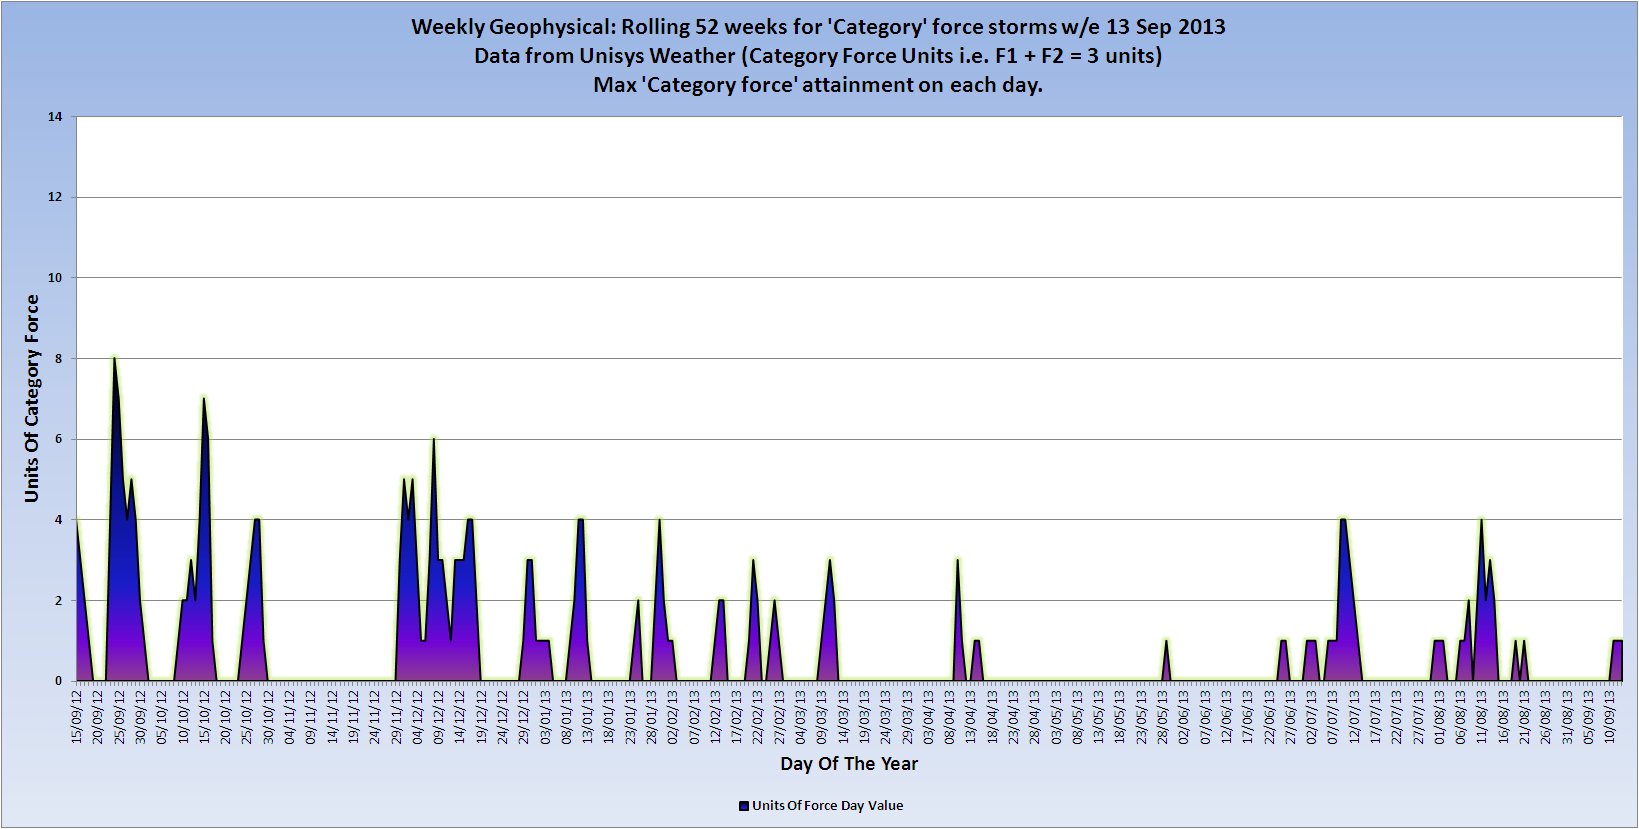
(Click the Image for a larger/clearer version)
Comparison of daily category attaiment and duration ctaegory attaiment
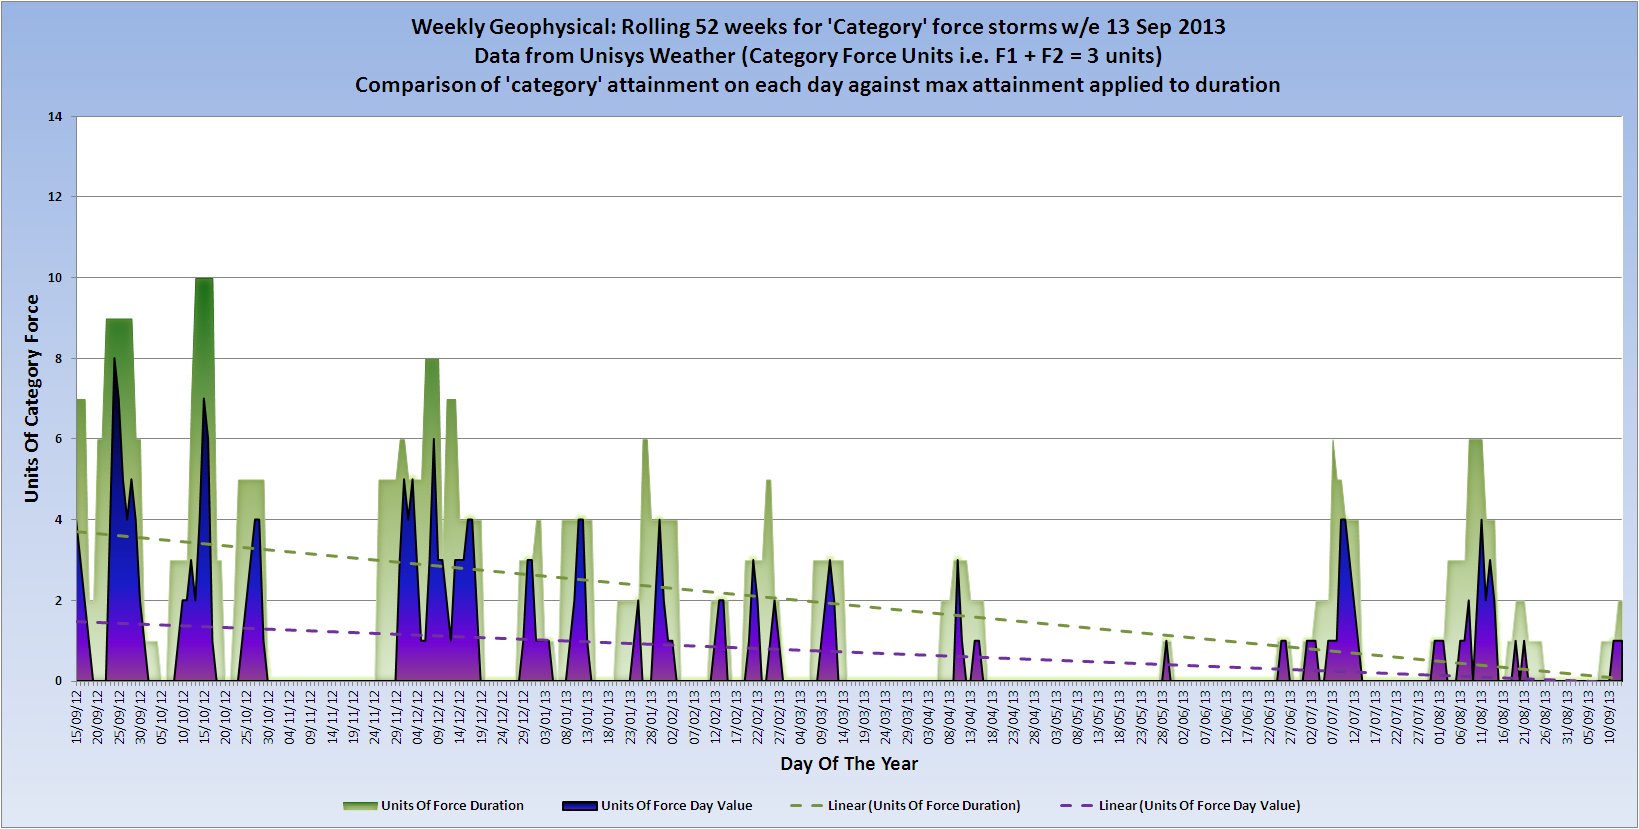
(Click the Image for a larger/clearer version)
Data courtesy of Unisys Weather
The category force storms contributing to the rolling calendar year chart are:
| Super Typhoon 5 | SANBA | 10/09/2012 | 17/09/2012 |
| Hurricane 1 | NADINE | 11/09/2012 | 04/10/2012 |
| Hurricane 1 | LANE | 15/09/2012 | 19/09/2012 |
| Super Typhoon 5 | JELAWAT | 20/09/2012 | 30/09/2012 |
| Hurricane 3 | MIRIAM | 22/09/2012 | 28/09/2012 |
| Typhoon 3 | PRAPIROON | 07/10/2012 | 19/10/2012 |
| Hurricane 1 | RAFAEL | 12/10/2012 | 17/10/2012 |
| Cyclone 3 | ANAIS | 12/10/2012 | 17/10/2012 |
| Hurricane 3 | PAUL | 13/10/2012 | 17/10/2012 |
| Hurricane 2 | SANDY | 22/10/2012 | 29/10/2012 |
| Typhoon 3 | SON_TINH | 23/10/2012 | 29/10/2012 |
| Super Typhoon 5 | BOPHA | 25/11/2012 | 09/12/2012 |
| Hurricane 1 | Unnamed (Atlantic) | 30/11/2012 | 01/12/2012 |
| Cyclone 3 | CLAUDIA | 06/12/2012 | 13/12/2012 |
| Cyclone 4 | EVAN | 11/12/2012 | 19/12/2012 |
| Cyclone 3 | FREDA | 28/12/2012 | 02/01/2013 |
| Cyclone 1 | DUMILE | 01/01/2013 | 05/01/2013 |
| Cyclone 4 | NARELLE | 07/01/2013 | 14/01/2013 |
| Cyclone 2 | GARRY | 20/01/2013 | 27/01/2013 |
| Cyclone 4 | FELLENG | 26/01/2013 | 03/02/2013 |
| Cyclone 2 | GINO | 11/02/2013 | 15/02/2013 |
| Cyclone 3 | HARUNA | 19/02/2013 | 25/02/2013 |
| Cyclone 2 | RUSTY | 24/02/2013 | 27/02/2013 |
| Cyclone 3 | SANDRA | 07/03/2013 | 14/03/2013 |
| Cyclone 2 | IMELDA | 06/04/2013 | 16/04/2013 |
| Cyclone 1 | VICTORIA | 09/04/2013 | 12/04/2013 |
| Hurricane 1 | BARBARA | 28/05/2013 | 30/05/2013 |
| Hurricane 1 | COSME | 23/06/2013 | 27/06/2013 |
| Typhoon 1 | RUMBIA | 28/06/2013 | 02/07/2013 |
| Hurricane 1 | DALILA | 30/06/2013 | 07/07/2013 |
| Hurricane 1 | ERICK | 04/07/2013 | 09/07/2013 |
| Typhoon 4 | SOULIK | 07/07/2013 | 13/07/2013 |
| Hurricane 1 | GIL | 30/07/2013 | 07/08/2013 |
| Hurricane 2 | HENRIETTE | 03/08/2013 | 11/08/2013 |
| Typhoon 4 | UTOR | 08/08/2013 | 14/08/2013 |
| Typhoon 1 | TRAMI | 17/08/2013 | 21/08/2013 |
| Typhoon 1 | PEWA | 18/08/2013 | 25/08/2013 |
| Hurricane 1 | HUMBERTO | 08/09/2013 | 16/09/2013 |
| Hurricane 1 | INGRID | 12/09/2013 | 16/09/2013 |
Solar Flux and Other Indices
SFU/AP Chart
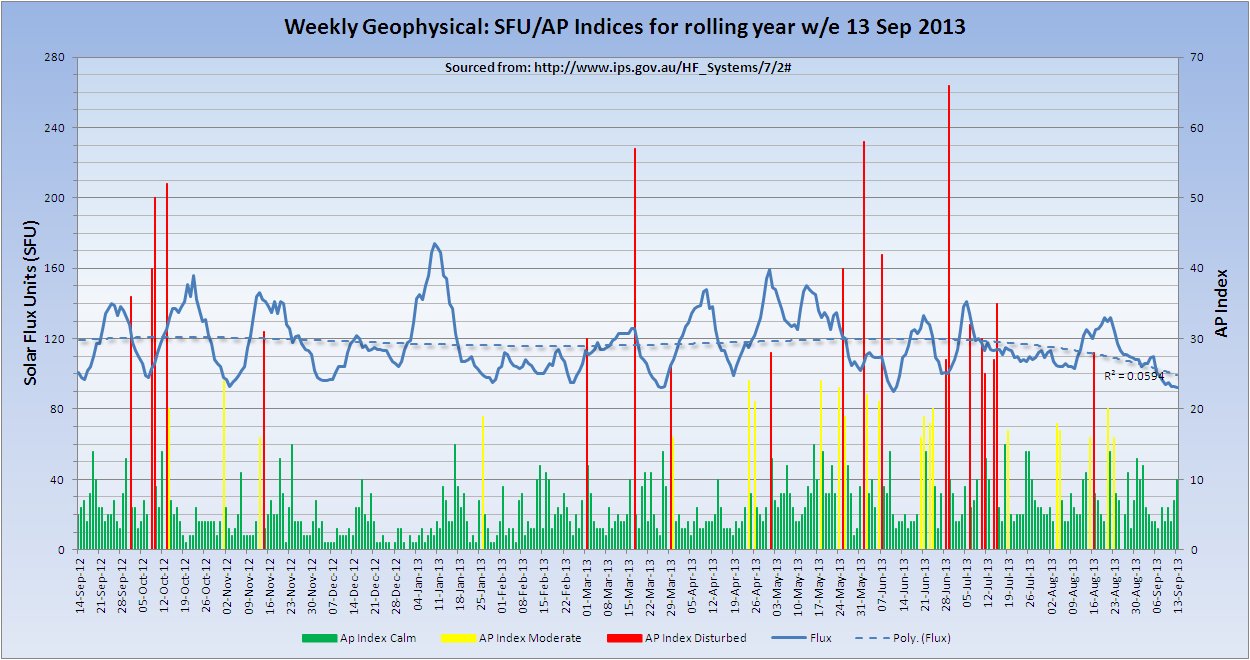
(Click the Image for a larger/clearer version)
Moscon Neutron Monitor
Neutron monitor ( cosmic ray station Moscow ) is situated 20 km south-west from Moscow in Troitsk town. It is operating in Cosmic Ray Department of Solar-Terrestrial Division of IZMIRAN. Principal Investigator: V.G.Yanke.
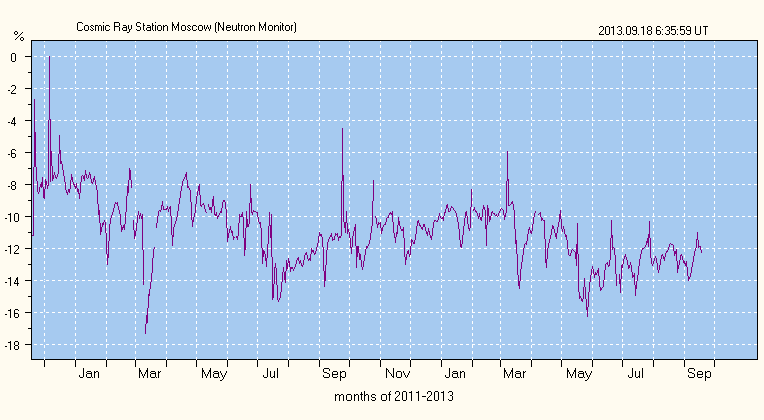
(Click the Image for a larger/clearer version)
Source of this image.
KP Indices (Musical Chart)
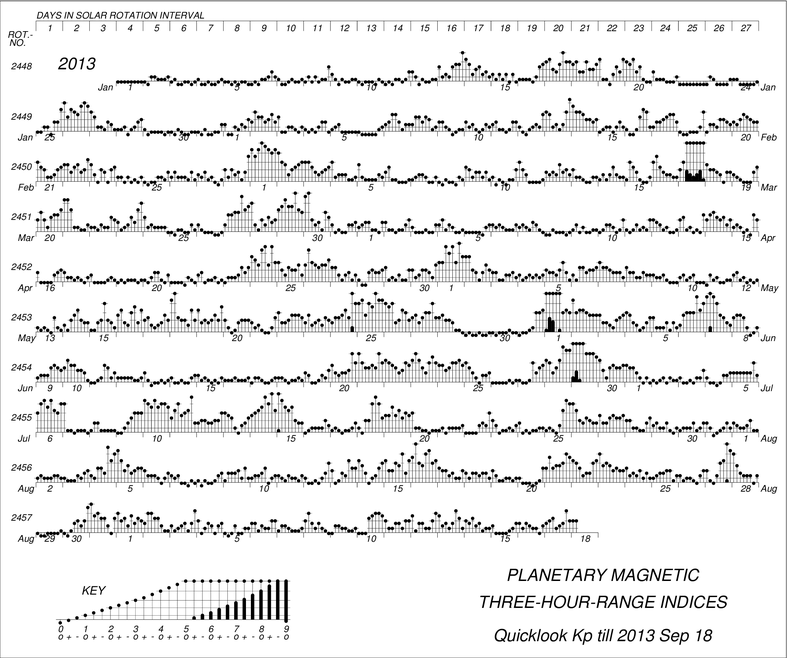
That concludes the report of the week ending 13 September 2013.