Last Updated on March 8, 2024 by Webmaster
Continuing on the theme of the supposed “increase” in earthquake activity one of the things I often come across is the nonsense graph that shows earthquakes going up and up since 1970.
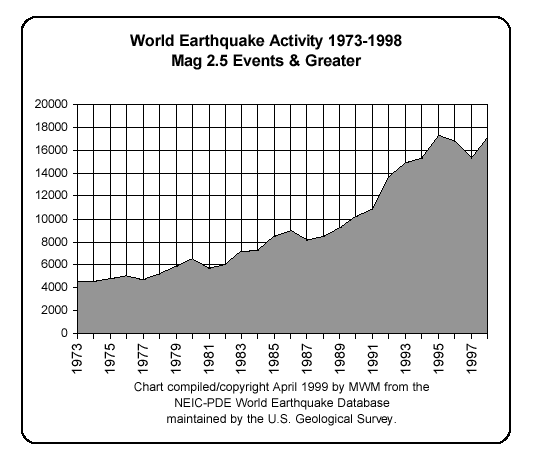
This takes the data from the USGS it says. The page referred to is probably this one as it was at the time. Since of course pdated.
Aside from the fact that the graph is now 20 years out of date, let’s take a look at the figures. Please also bear in mind that, as the site states:
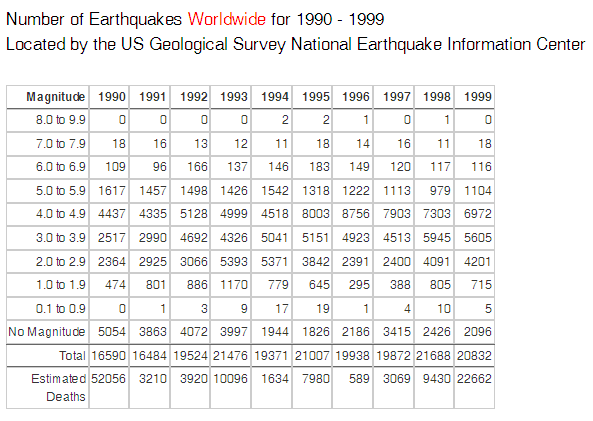
As more and more seismographs are installed in the world, more earthquakes can be and have been located. However, the number of large earthquakes (magnitude 6.0 and greater) have stayed relatively constant.
First World wide figures for 1990 to 1999
Now the earthquakes for the United States
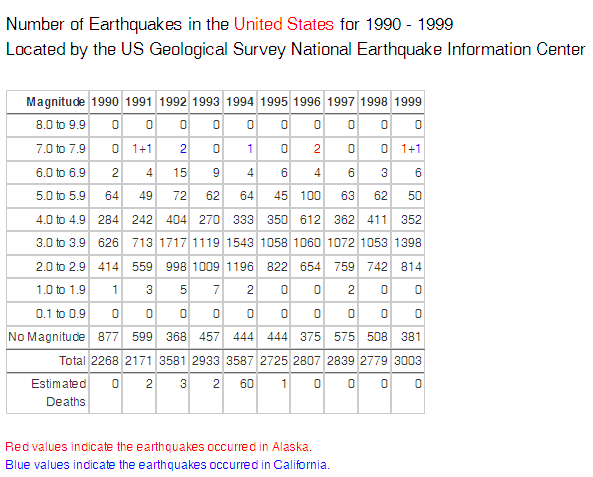
It is relatively easy to see that the USGS statement is correct. It is also relatively easy to see that the US quakes are fairly constant as fewer new seismographs were installed pro-rata than worldwide.
If we take the total of the quakes compared to the total number of 5.0+ we can see that the number of the larger quakes in that time period actually went down.
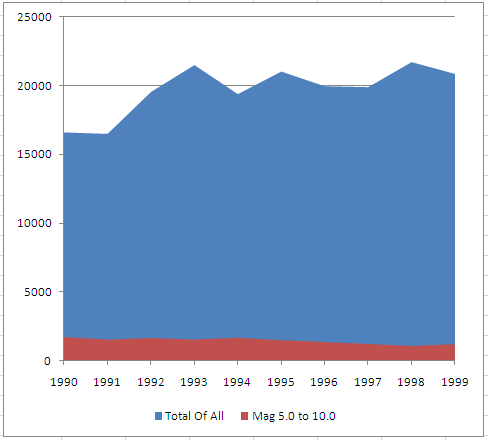
Later still, from 2000 to 2021 inclusive we see the same pattern as 1990-1999

Basically the Mandeville graph presented is based on bad science and serious logic flaws.

So to the numbers
Let us look at Baja California since 01-01-2010. Since that date there have been 22,247 earthquakes from mag 1 upwards – counting up to a day ago.
For each band of earthquakes I calculated the energy released using the formula
(10^(4.8+(magnitude*1.5)))/10^12
which gives us the gigajoules of energy released.
I have bunched everything under 3.0 into one band.
- 1.0 to 2.99 – 20,766 earthquakes released 2.5611 GJ energy
- 3.0 to 3.99 – 1,316 earthquakes released 11.92 GJ energy
- 4.0 to 4.99 – 153 earthquakes released 40.4201 GJ energy
- 5.0 to 5.99 – 11 earthquakes released 80.3913 GJ energy
- There were no 6.0
- 7.2 – 1 earthquake released 3,981.0717 GJ energy