Last Updated on July 21, 2024 by PuterMan
2008 was not considered to be a particularly active year despite the high count. There was not even a magnitude 8 during the year. In fact there were fewer magnitude 7 earthquakes than average as well so it really was a quiet year. This is one of the reasons why I personally take little notice of the counts and prefer to use the energy released.
2004 of course had the magnitude 9 that gave rise to the Indonesian tsunami with such destructive results and great loss of life. But without that one single event 2004 was very quiet. If that single earthquake is removed from the figures it makes a drastic difference to the energy release and makes 2004 the quietest of all the years except 2008.
The next table is the released energy by magnitude band.
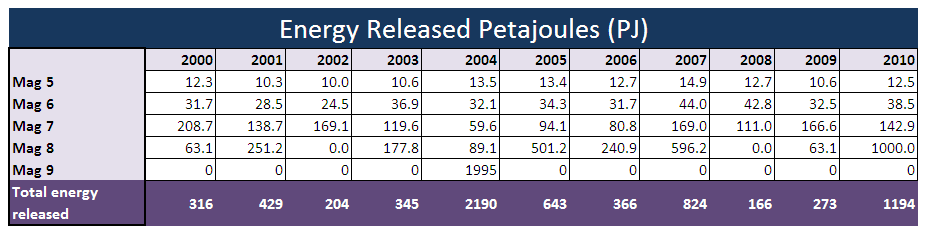
Here I have uplifted the calculated Terajoules to Petajoules to fit the display better. In terms of overall energy released 2010 is again higher than all other years except 2004 this time. The interesting thing is that whilst in terms of numbers (count) 2010 is pretty much level pegging with 2008, in terms of release it is only a little over half of the 2004 energy.
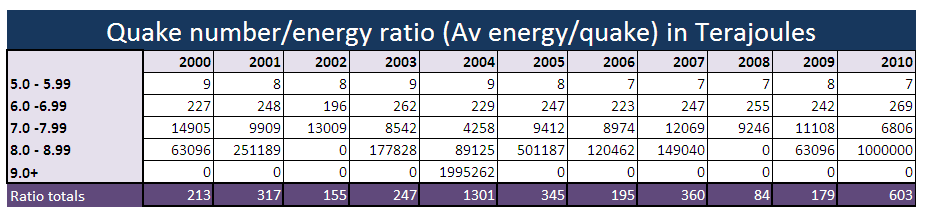
Taking a look at the energy per quake (which is not a particularly meaningful figure, just an indicator) we can see that 2010 still scores higher than all year other than 2004 – which is to be expected due to the massive magnitude 9 earthquake in 2004. You can see from the figures that this magnitude 9 released almost twice the amount of energy of the magnitude 8.8 in Chile.
In many respects 2010 can be equated to 2004 in that removing the one single large earthquake in each year then puts each year much lower down the league table, in fact almost at the bottom in each case in terms of energy.
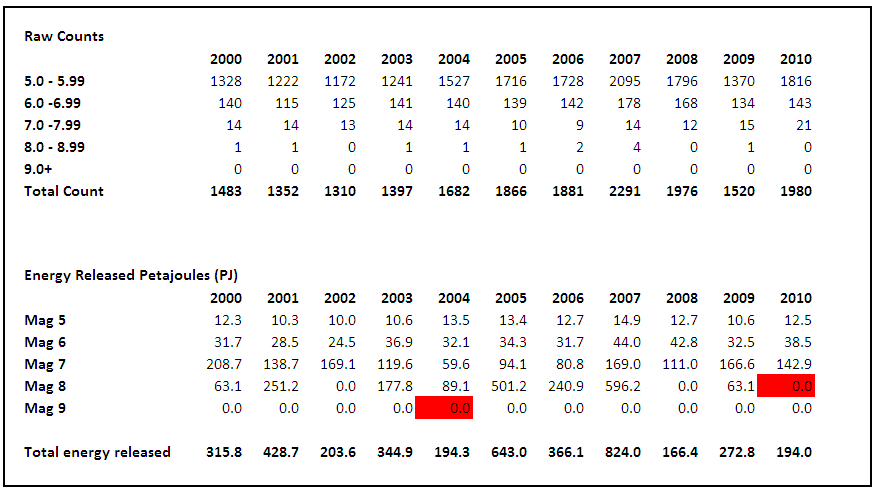
Note that doing this, 2004 and 2010 are almost bottom, with only 2008 – the quiet year – being lower in terms of energy release.
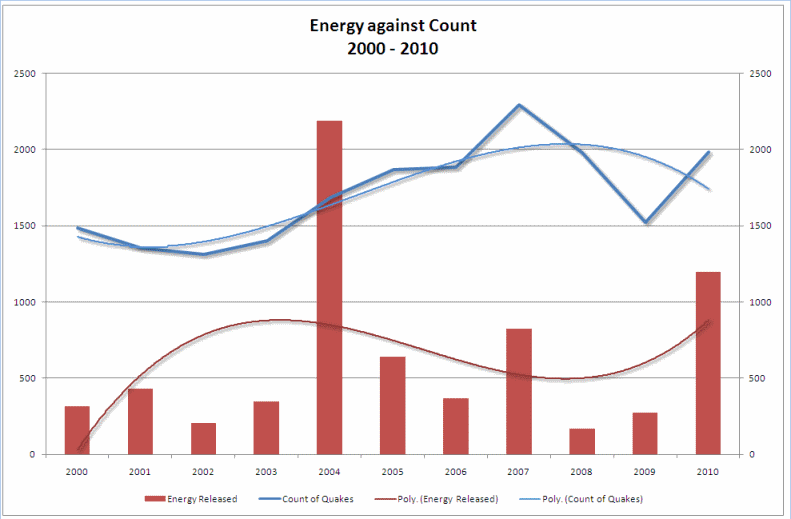
Looking at the results like this it becomes immediately clear the impact that the single large earthquake in 2004 and 2010 respectively had upon the overall.