Last Updated on July 21, 2024 by PuterMan
There is little point in showing a single 9 in the charts so I will now combine the 8 and 9 magnitudes.
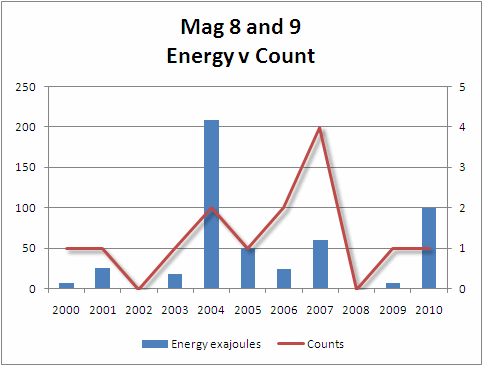
Energy on the left axis and counts on the right axis.
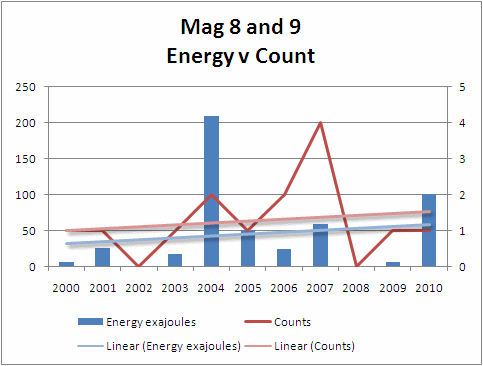
Here is the same graph with a trendline (polynomial 4) for each element.
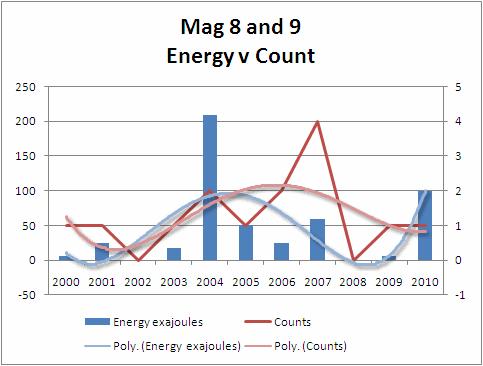
Either linear or polynomial the trend over the 11 year period is slightly upwards for both number and energy released, but it must be said that the increase is not massive.
The ratios of all the quakes together are below.
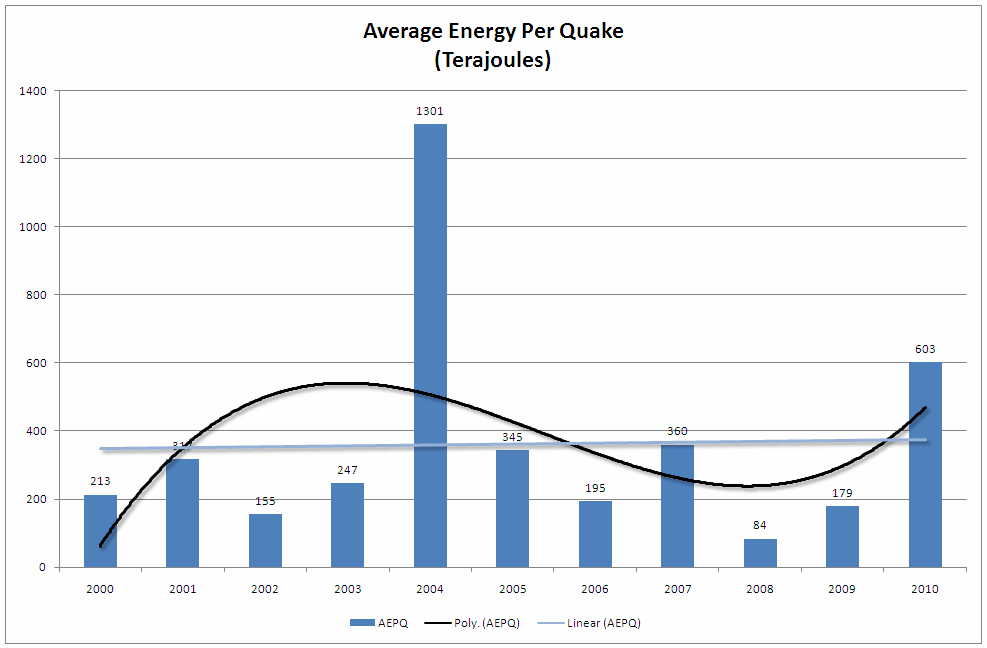
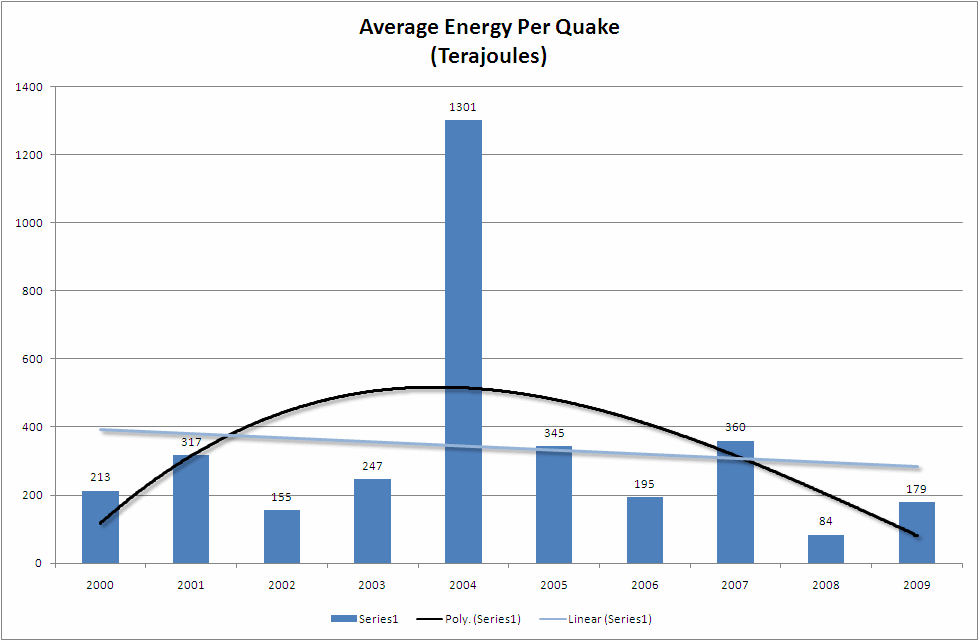
[i]Chart of the Energy/Count ratio in Terajoules[/i]
This is a pretty minimal trend especially viewed as a linear trend and it could well be imagined that if history repeated itself and the overall energy falls for the next couple of years following the Chile earthquake, the trend could tip downwards.
By removing 2010 from the chart one can see just how easily at these higher magnitudes a small change can have a great influence.
In conclusion therefore, in my opinion as a non-scientist, I believe that 2010 in terms of earthquakes was not a particularly outstanding year.
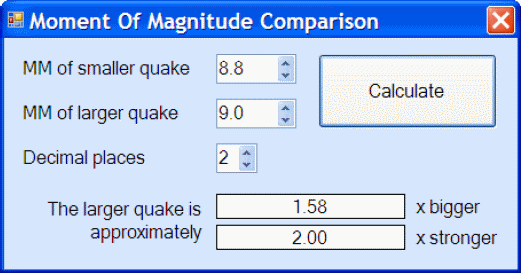
Whilst it was the second highest of the eleven years in term of energy released, the energy was well below that of 2004 because the 9.0 was one and a half times bigger than the 8.8 but twice as strong.
I believe that much of the ‘unrest’ was occasioned by the Chile earthquake which shook things up a bit and I am reasonably sure that we will see a settling down over the next two or three years.
In theory it should be possible to do this exercise with another provider – for example EMSC and whilst there are times when the EMSC data returns a higher magnitude than the USGS, there are also times when it is the other way round. I believe that the outcome would not be significantly different. It is an exercise I shall be carrying out during 2011.