Last Updated on July 21, 2024 by PuterMan
Without the one quake in those years the graph looks like this:
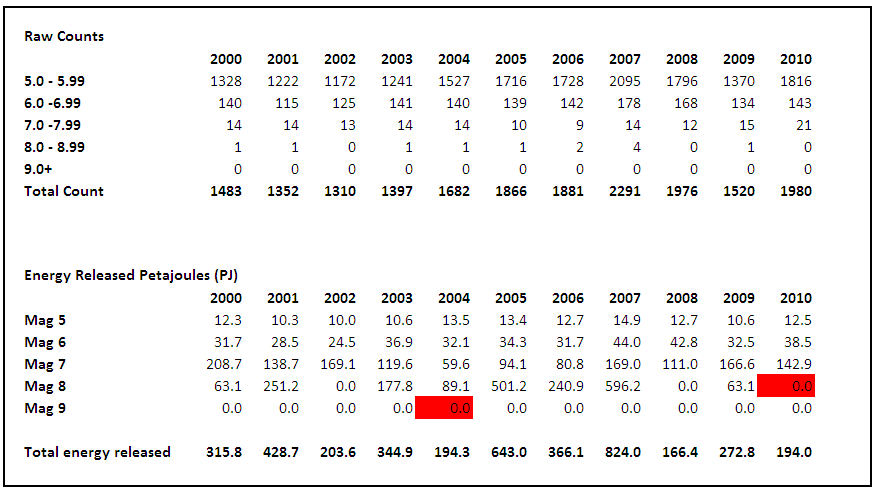
It may not be a proper results set, but it does illustrate just how powerful these larger earthquakes are in terms of energy.
Another comparison is average energy per quake. This is possibly a questionable figure in terms of realistic expectation, since you will never get an ‘average’ earthquake, but as a statistic it does give another overview on each earthquake band in each year. First take a look at Magnitude 5 earthquakes.
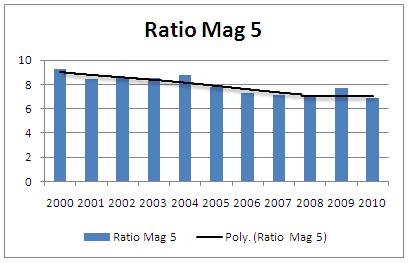
As you can see the average energy of magnitude 5 quakes has fallen over the decade and into 2010.
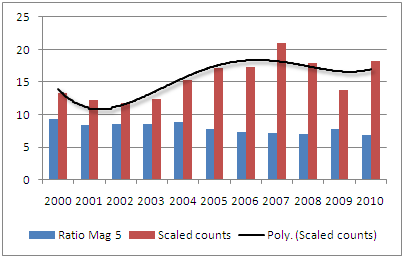
I scaled the counts by a factor of 100 so that they did not swamp the graph. Now you can see above the counts alongside the ratio. As you can see the trend of magnitude 5 earthquakes rose up to 2005 and from then on through to present has flattened off. In fact the average is 1705 Magnitude 5 quakes from 2004 to 2010 so at 1813 mag 5 to 5.99 quakes this last year was hardly significant. It is higher against the 1520 for 10 years.
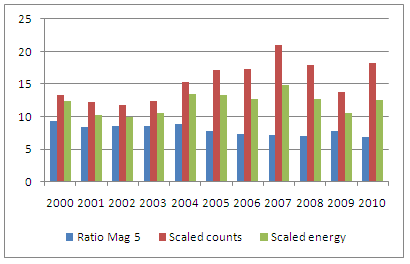
With the energy added you can now see why the overall ratio has fallen, and to be fair pretty much flattened out in the last few years. The average energy for magnitude 5.0 to 5.99 quakes over the 11 year period is 12.1 petajoules per year. 2010 @ 12.5 PJ is right on the mark.
So how about Magnitude 6 quakes?
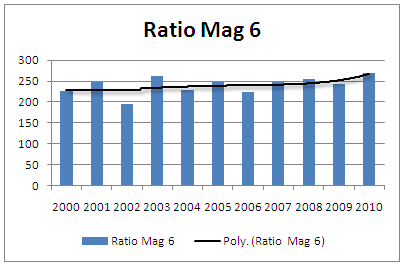
No real scares here, in fact the magnitude 6 figures are pretty flat for the most part with average ratio of 240 terajoules per quake for the 11 year period. 2001 weighs in at 269, which is only fractionally higher than the 2003 figure, but it has to be said that 2003 and 2010 are the top two. So let’s look at the graphs for these:
Now with the counts added:
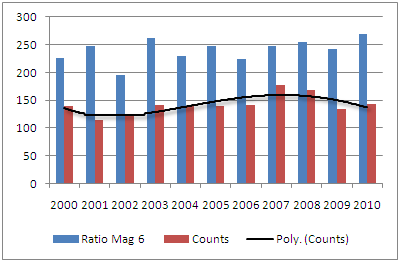
Even though this line is not as ‘straight’ as the ratios, nevertheless the overall picture is of an even distribution of counts with the average raw counts for the 11 year period as 142. 2010 is not out from the average at all with 143 counted.
So now the energy added:
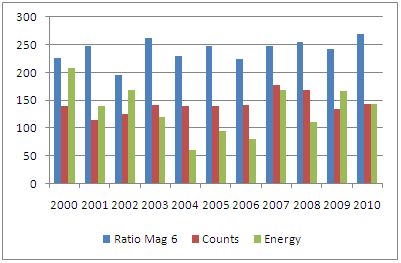
Again this is not out of the ordinary as the average for the 11 years is 132 terajoules per magnitude 6 quake and the 2010 value is 142 terajoules.
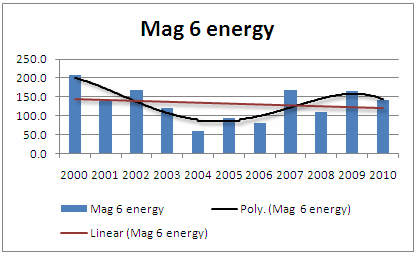
The overall trend of 6.0 magnitude quakes over the eleven years is down as shown on this graph with a polynomial (4) trend and a linear trend together: