Last Updated on July 21, 2024 by PuterMan
A comparison of the total of earthquakes for 2010 to the preceding years 2000 – 2009.
PDF version available here.(This is the revised version with ANSS data for 2009/2010)
The general impression that abounds is that 2010 was a particularly bad year for earthquakes and that the global incidence of earthquakes is on the increase. But is this indeed so? I take a look at the figures for 2010 and compare them to earlier years on the basis of numbers (which I do not personally consider a viable method of comparison) and on the basis of energy released which I consider to be a more realistic method.
A description of the data sources I used and the spreadsheets into which the data was loaded can be found at the end of the document together with links detailing the source web sites and to a download of the spreadsheet files.
The final two years comprise data that I have collected using the QVS Data program. Since this data is a mixture of USGS, EMSC and GeoNet (New Zealand) data, all non USGS data was removed leaving only that data which has been supplied by the USGS in the 7 day files available on the Internet. These files are downloaded into the program at 5 minute intervals during the day and thus catch any revisions and/or deletions provided they happen within a 7 day time span. For the most part I consider this to be the case.
To get a figure for energy it was assumed that all earthquakes were of the same scale (which some may not be) since any differences would be minor and should tend to cancel out.
The formula used is:
Es = (10^(4.8+(G2*1.5)))/(10^12)
This gives an energy value in Terajoules and since a magnitude 5 earthquake is 2 TJ of energy this scale has been used throughout. See Wikipedia for information on Joules
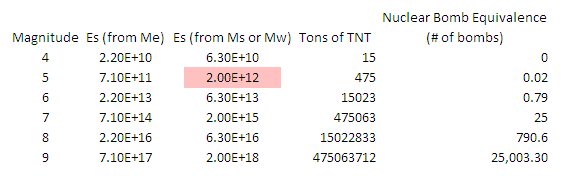 The table above and the information on the calculation was taken from the USGS page on FAQs – Measuring Earthquakes.
The radiated energy can be obtained in various ways. Historically, the radiated energy was estimated empirically (from observations) from magnitude Ms through the Richter formula, log Es = 4.8 + 1.5Ms, where Es is seismic energy in Joules. In this formula, magnitude is measured first, after which the formula is used to obtain Es.
The data is collected into a front sheet in each spreadsheet, and then to a collection in the main spreadsheet. At this point the aggregated values have been converted to Petajoules. (For the data should you require it you will find that I have amalgamated the spreadsheets all into one, the link for which is at the bottom of the last page)
Without further ado the basic figures look like this. First the raw count of earthquakes:
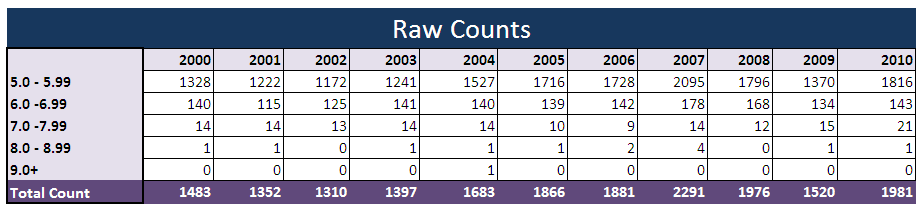
As you can see from the table 2010 beats all years in the decade 2000 to 2009 with the exception of 2007 which was more active for counts but lower for energy. 2008, only just pipped at the post in terms of count, was actually the lowest for energy of all 11 years.